


Search Results by Category
All information related to {{ key_word }}.
AI Navigator will guide you. Click here for information about {{ key_word }}.
Images
 4
4
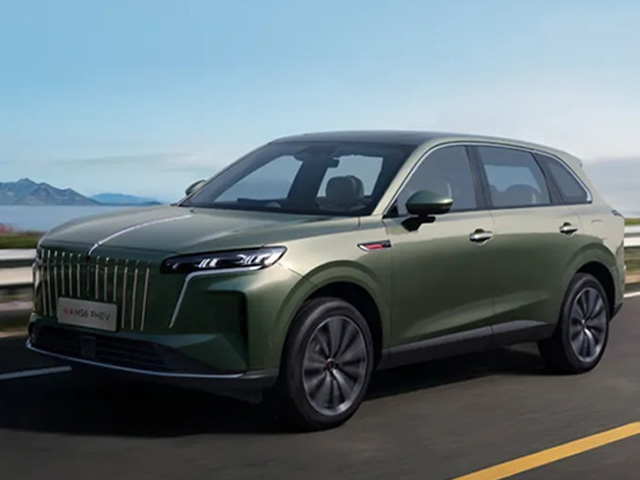
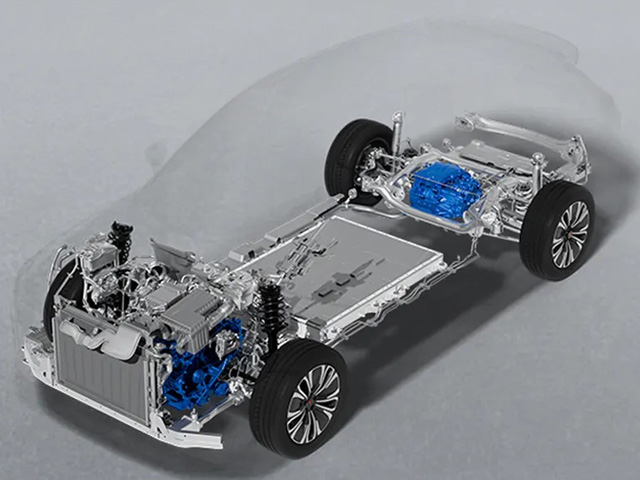
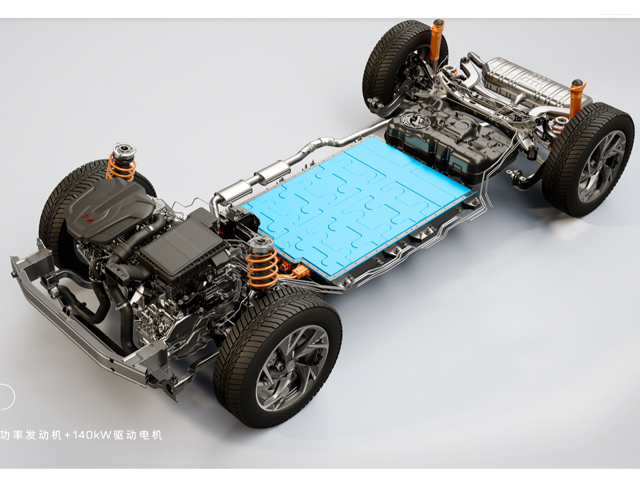
Hongqi HS6 PHEV
 3
3
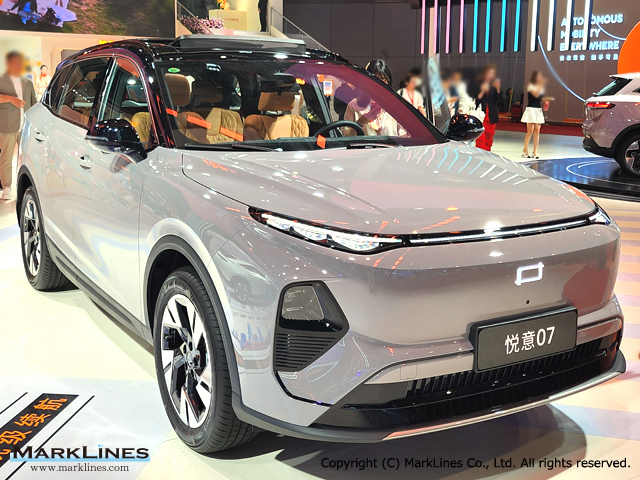
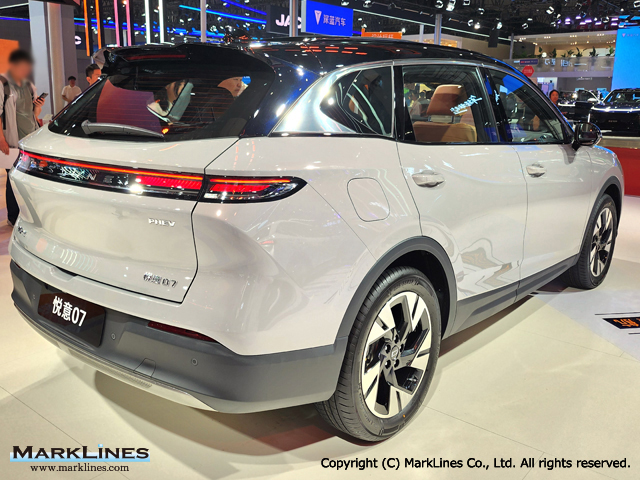
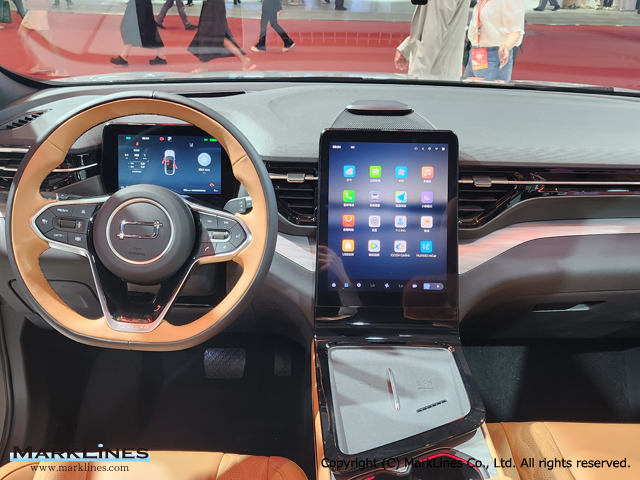
Bestune Yueyi 07
 4
4
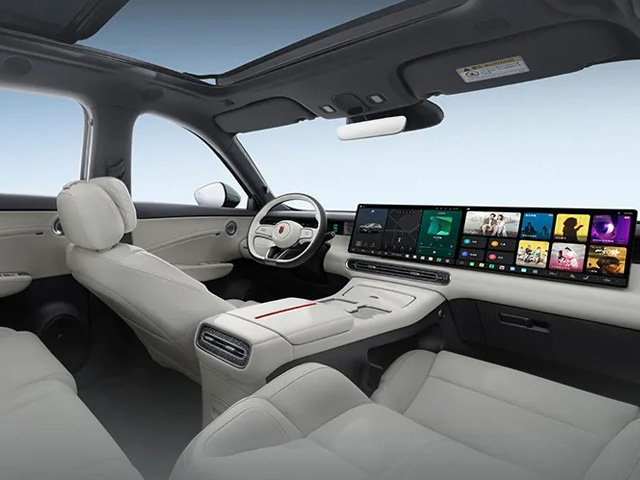
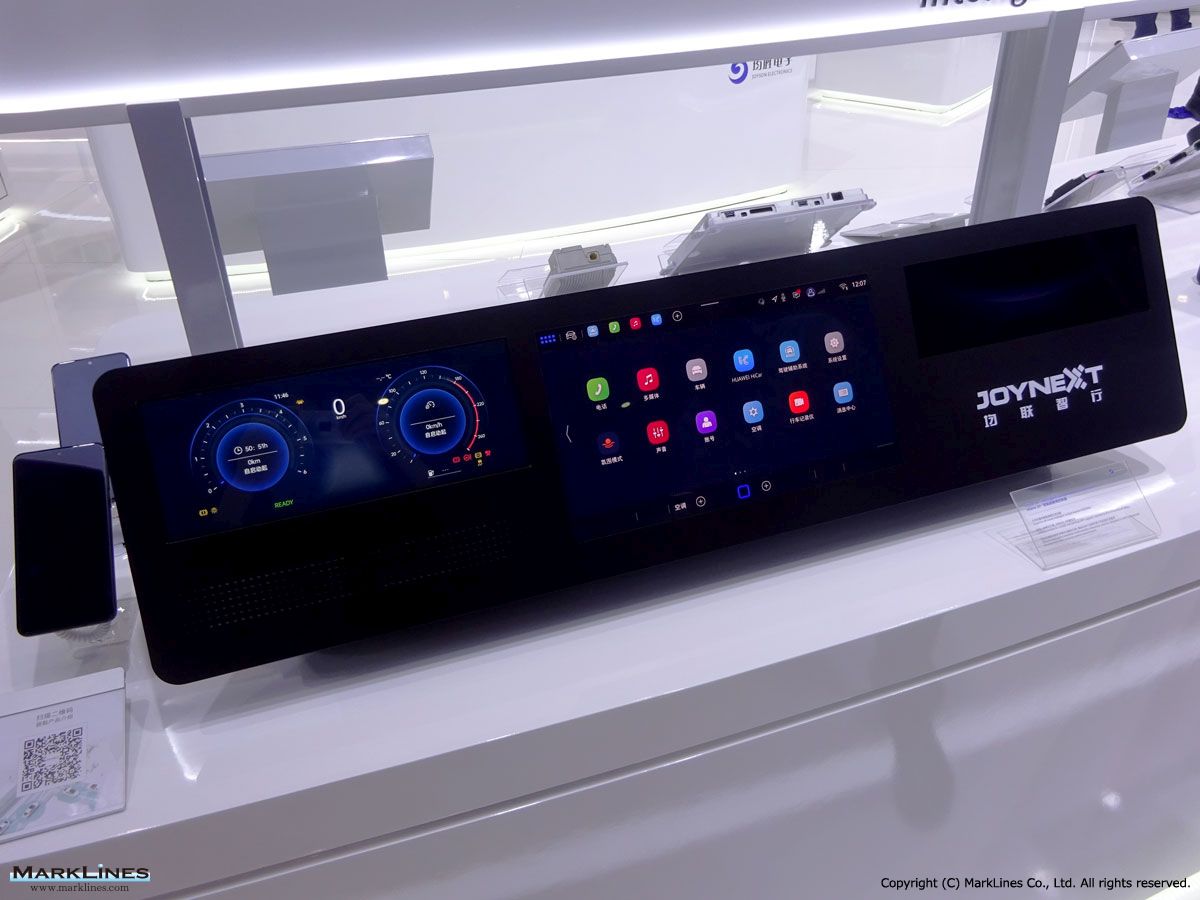
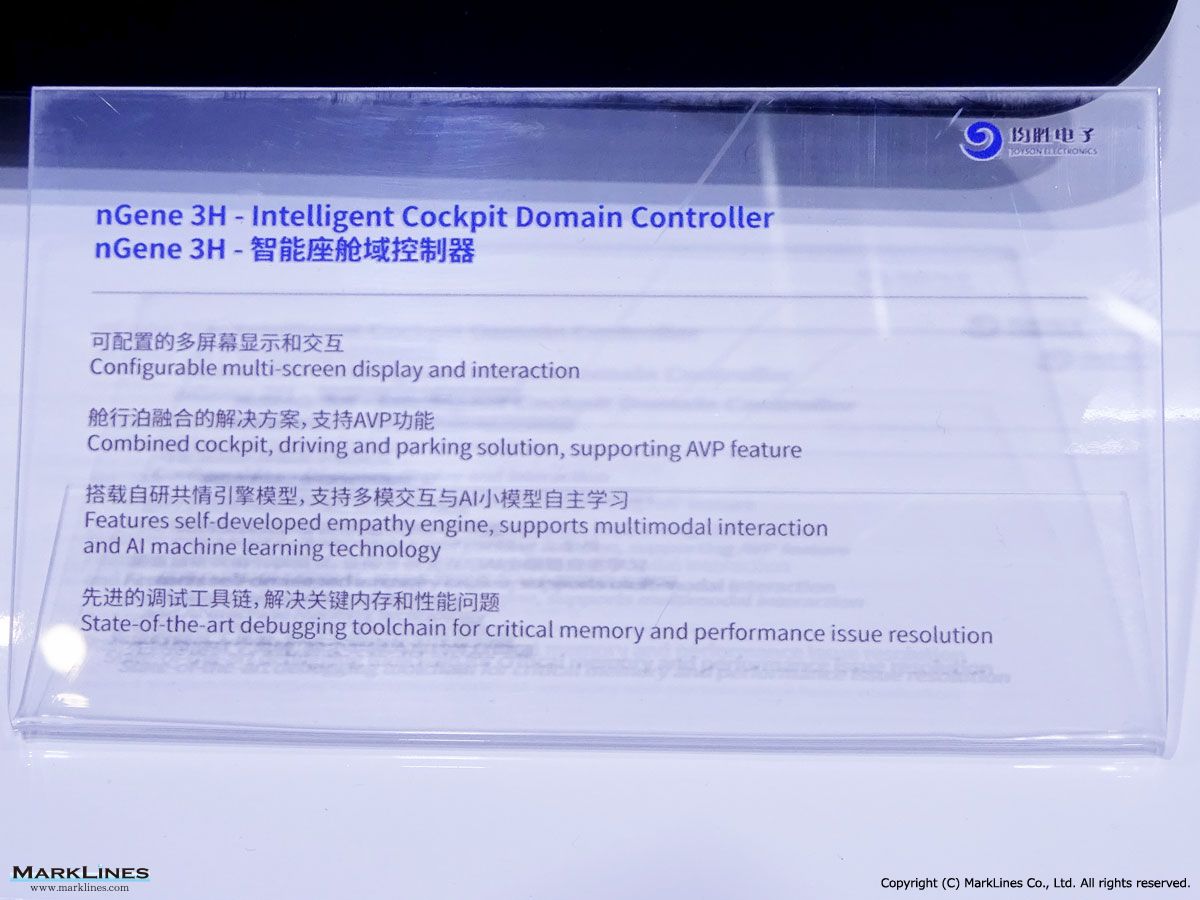
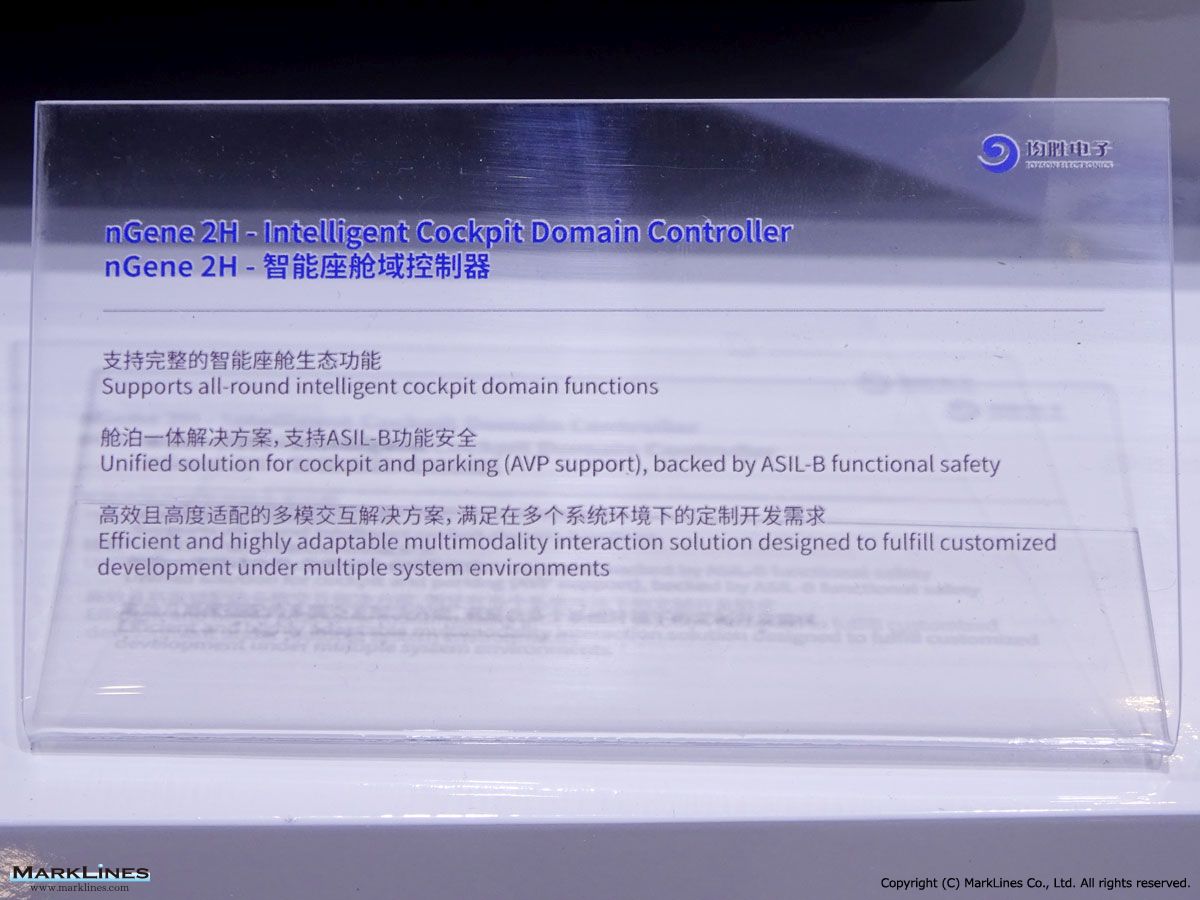
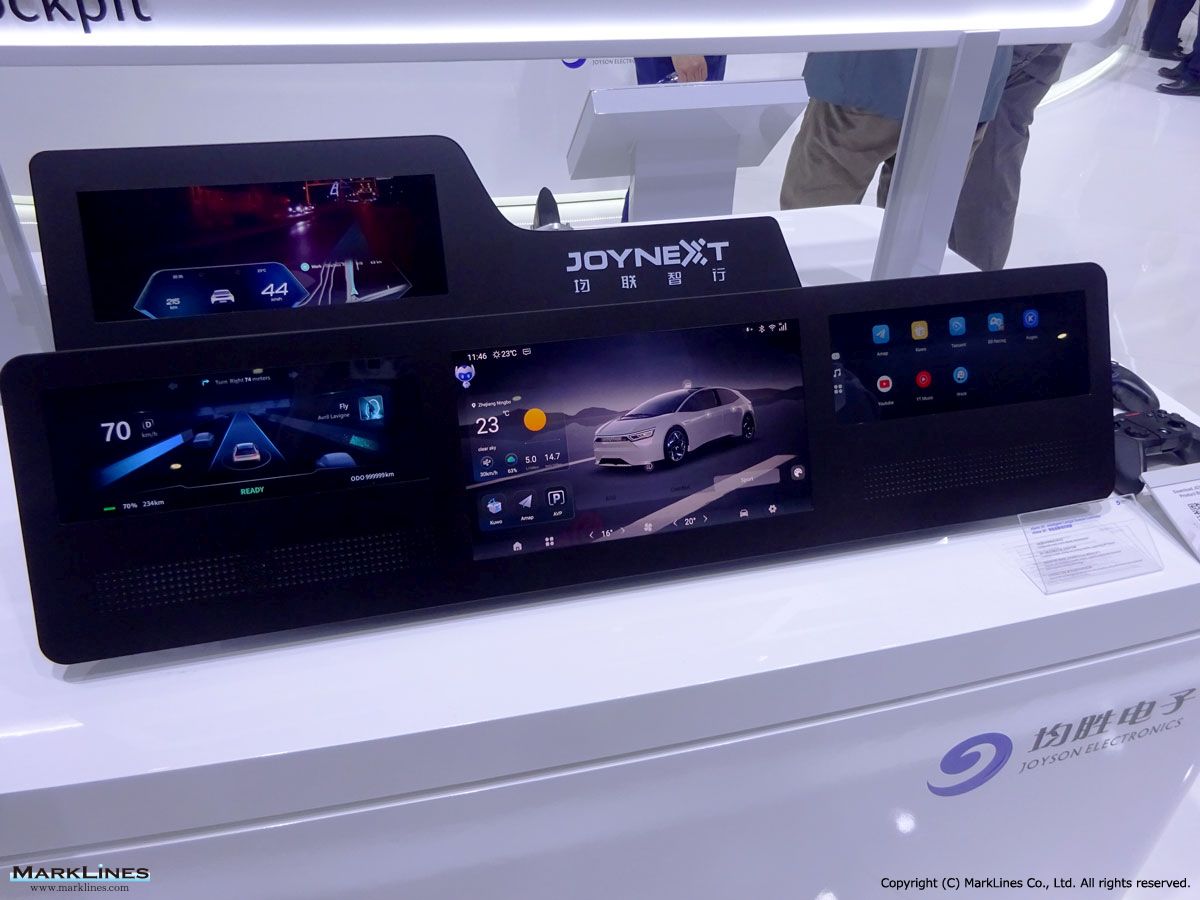
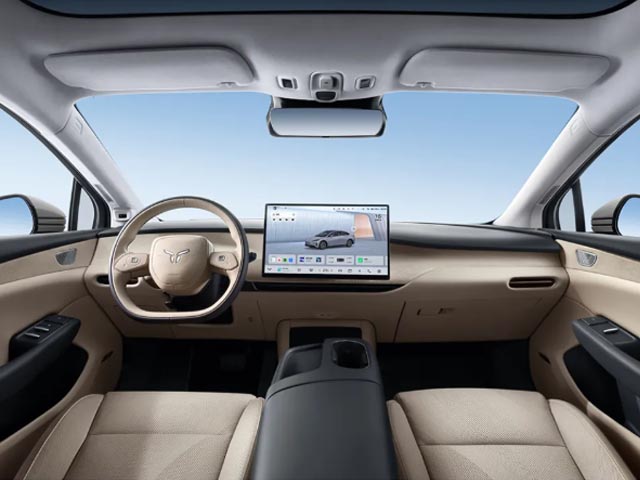
Intelligent cockpit products
 3
3
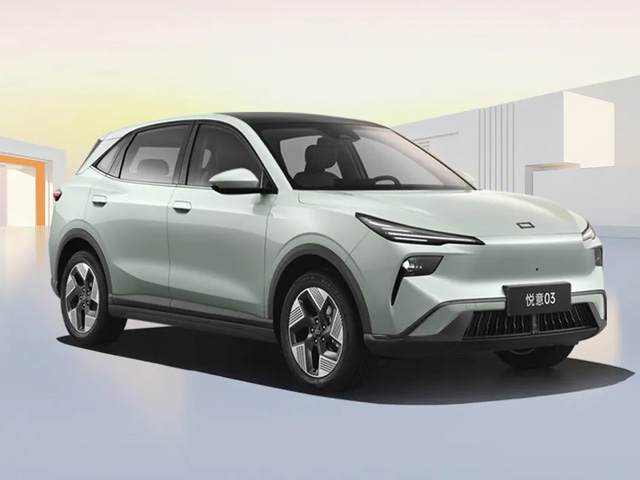
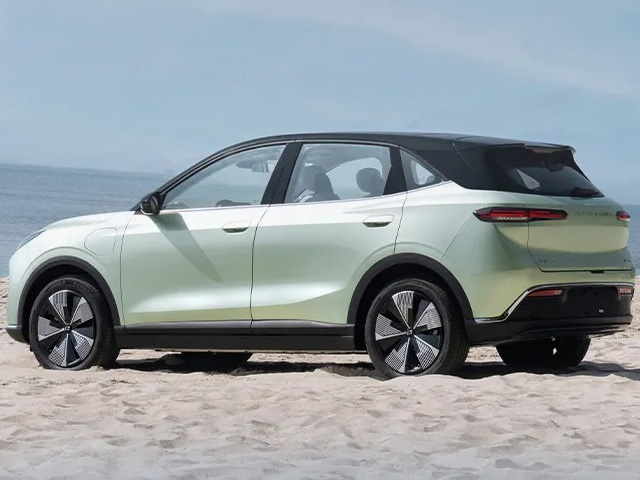
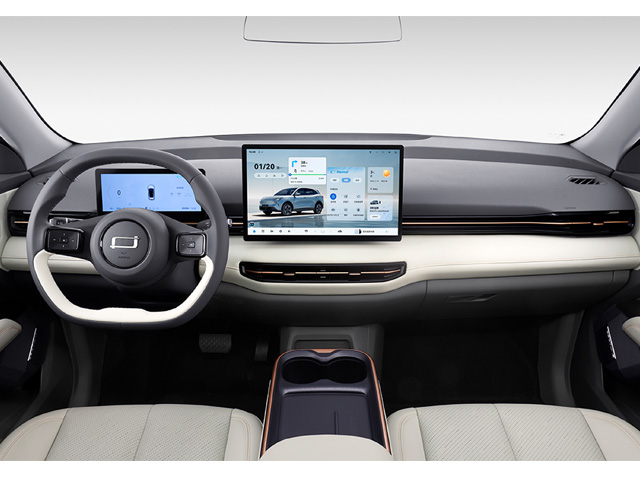
Bestune Yueyi 03
 5
5
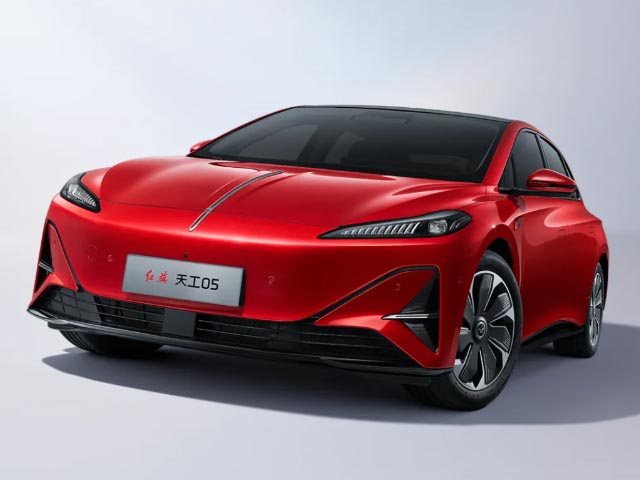
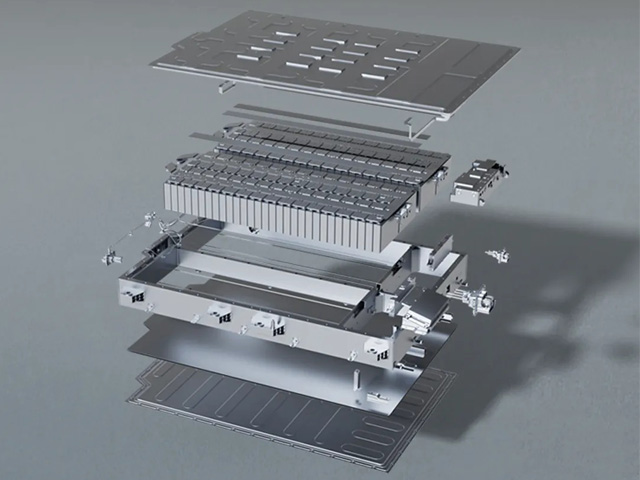
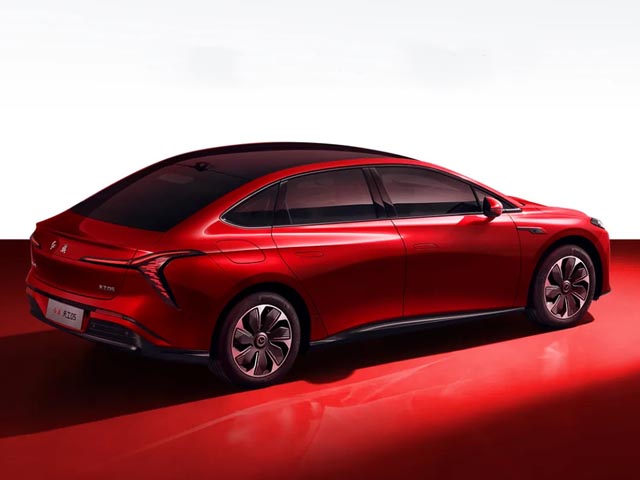
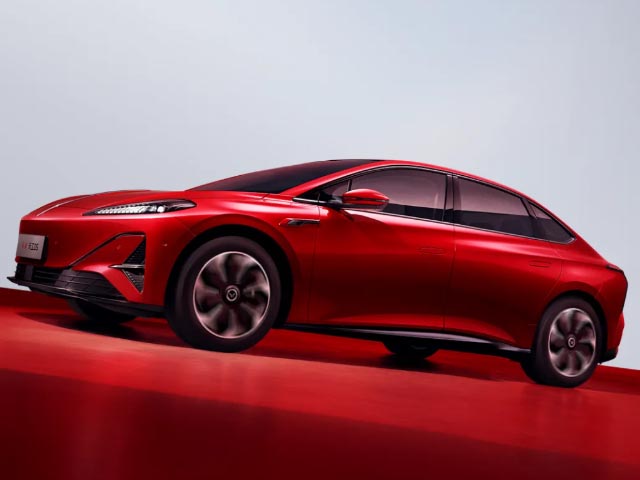
Hongqi Tiangong 05
 1
1
Hongqi Tiangong 08
 1
1
Bestune Xiaoma
 2
2
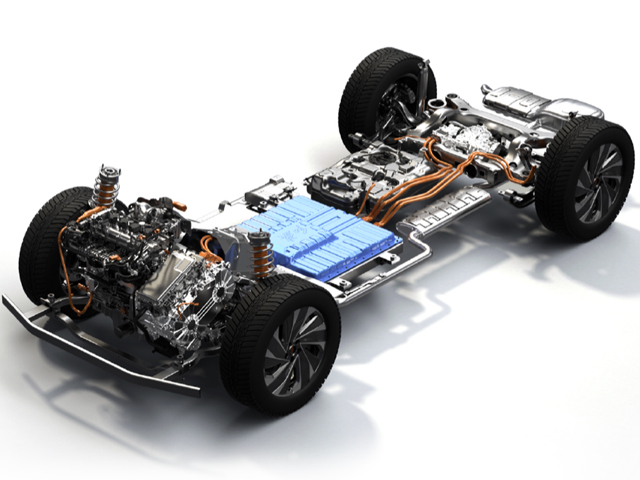
Hongqi HS3 PHEV
 3
3
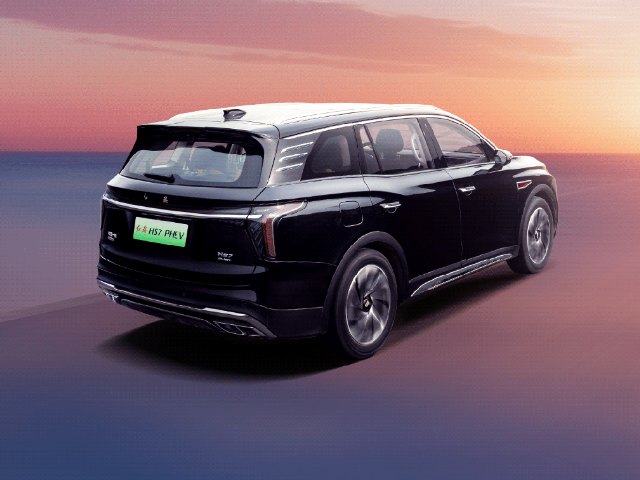
Hongqi HS7 PHEV
 1
1
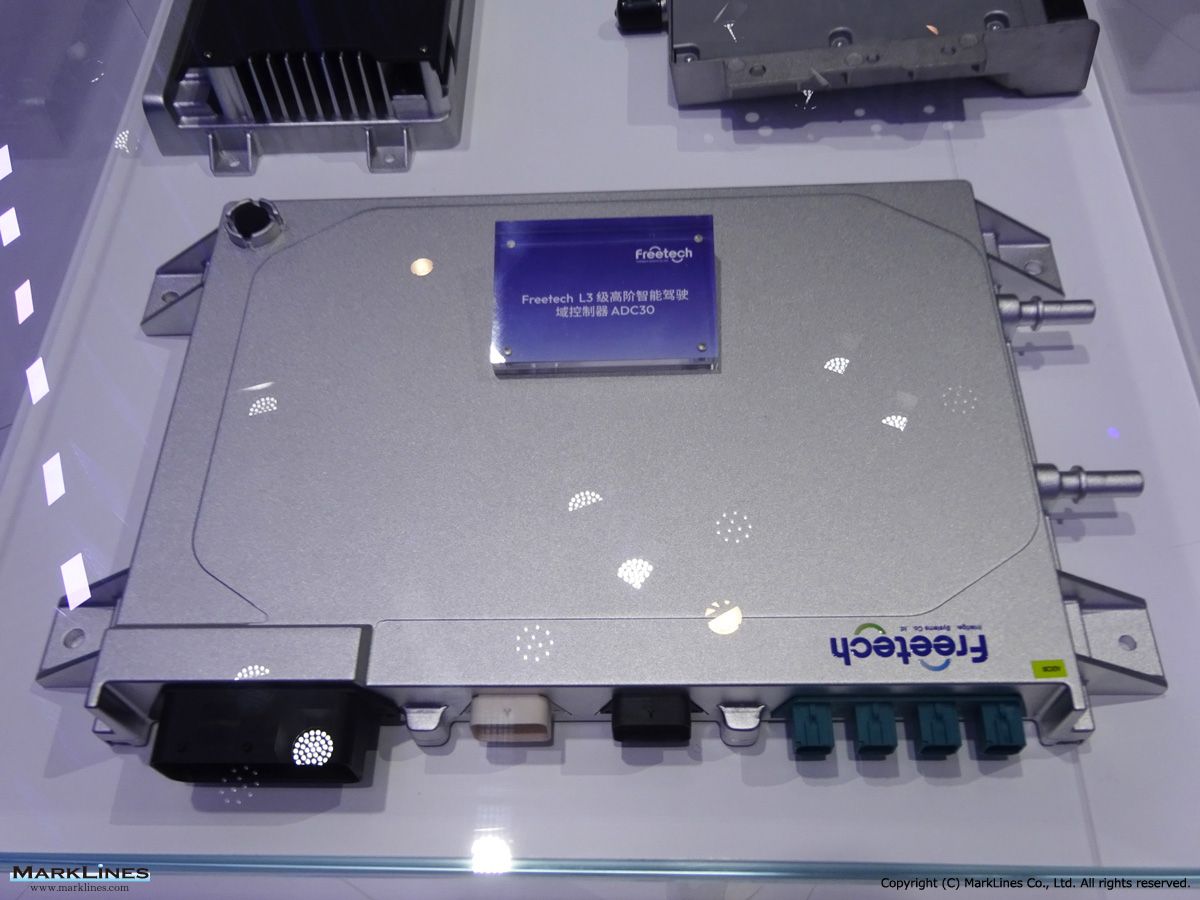
Freetech L3 domain controller ADC30
Sort by :
1 - 20 of 45 results
Russia - New car sales in 2026 by OEM, vehicle type
100.0% -9.3% 5,907 100.0% 7,141 100.0% -17.3% Trucks - Maker 2026 2025 Y-o-Y 2026 2025 Y-o-Y Apr. Share Apr. Share Jan.-Apr. Share Jan.-Apr. Share 1 KAMAZ 1,920 38.8% 1,494 30.0% 28.5% 5,819 34.8% 6,016 27.9% -3.3% 2 Sinotruk 481 9.7% 734 14.7% -34.5% 1,818 10.9% 3,844 17.8% -52.7% 3 FAW 344 7.0% 335 6.7% 2.7% 1,175 7.0% 1,529 7.1% -23.2% 4 Maz 316 6.4% 281 5.6% 12.5% 1,012 6.0% 1,136 5.3% -10.9% 5 GAZ 297 6.0% 409 8.2% -27.4% ...
Automotive Sales Data Updated at: 2026/05/15
China - New car sales in 2026 by OEM, model, vehicle type
t) to be released later on our data for monthly sales volume.This is due to the difference in calculation methods. Passenger Car retail sales by Chinese Makers Top10 - Maker Apr. 2026 (10,000) Y-o-Y 1 BYD Auto 18.2 -32.3% 2 Geely Automobile 15.2 -27.4% 3 Changan Automobile 9.5 -11.0% 4 FAW-VW 7.5 -32.1% 5 Chery Automobile 6.8 -30.5% 6 Leapmotor 5.7 63.5% 7 SAIC-GM-Wuling 5.4 -30.3% 8 GAC Toyota 5.4 -9.9% 9 SAIC VW 4.6 -44.8...
Automotive Sales Data Updated at: 2026/05/15
Indonesia - New car sales in 2026 by OEM
-% -% GWM 248 0.3% 35 0.1% 608.6% 1,127 0.4% 368 0.1% 206.3% DFSK 124 0.2% 63 0.1% 96.8% 366 0.1% 329 0.1% 11.2% Citroen 123 0.2% 90 0.2% 36.7% 414 0.1% 517 0.2% -19.9% Lexus 118 0.1% 191 0.4% -38.2% 304 0.1% 532 0.2% -42.9% Mercedes Benz 111 0.1% 133 0.3% -16.5% 592 0.2% 598 0.2% -1.0% FAW 107 0.1% 60 0.1% 78.3% 347 0.1% 235 0.1% 47.7% Ford 102 0.1% 92 0.2% 10.9% 305 0.1% 255 0.1% 19.6% UD Trucks 80 0.1% 189 0.4% -57.7% 261 0.1% ...
Automotive Sales Data Updated at: 2026/05/13
South Africa - New car sales in 2026 by OEM, vehicle type
6 0.5% Mazda 191 0.4% Mitsubishi 185 0.4% Jaguar 175 0.4% Honda 153 0.3% Porsche 108 0.2% Changan 94 0.2% Volvo 76 0.2% Subaru 35 0.1% Ferrari 8 0.0% Proton 7 0.0% Apr.2026 Total 45,380 - Apr.2025 Total 40,106 - Y-o-Y 13.2% - Commercial Maker/Brand Apr. 2025 Share FAW 517 19.9% Toyota 346 13.3% Daimler Trucks and Buses 238 9.2% Isuzu 213 8.2% Scania 197 7.6% UD Trucks 178 6.8% Volvo 177 6.8% MAN 12...
Automotive Sales Data Updated at: 2026/05/07
Russia - New car sales in 2025 by OEM, vehicle type
are Jan.-Dec. Share 1 KAMAZ 2,440 36.3% 2,249 25.9% 8.5% 18,333 29.8% 23,121 18.3% -20.7% 2 Sinotruk 954 14.2% 1,153 13.3% -17.3% 9,803 15.9% 25,280 20.0% -61.2% 3 GAZ 505 7.5% 765 8.8% -34.0% 4,698 7.6% 7,543 6.0% -37.7% 4 Shaanxi 370 5.5% 734 8.5% -49.6% 4,667 7.6% 15,545 12.3% -70.0% 5 FAW 480 7.1% 746 8.6% -35.7% 4,452 7.2% 11,680 9.3% -61.9% 6 Maz 415 6.2% 579 6.7% -28.3% 3,274 5.3% 5,719 4.5% -42.8% 7 URAL 272 4.0% 258 3.0% 5....
Automotive Sales Data Updated at: 2026/03/03
Indonesia - New car sales in 2025 by OEM
Mercedes Benz 255 0.3% -33.9% 2,344 0.3% -37.6% MG 259 0.3% 102.3% 2,018 0.3% -49.2% BMW 308 0.3% -44.2% 1,922 0.2% -58.9% GWM 178 0.2% 85.4% 1,628 0.2% 104.5% UD Trucks 101 0.1% -16.5% 1,627 0.2% -17.0% Citroen 368 0.4% 206.7% 1,577 0.2% 19.1% Lexus 81 0.1% -48.1% 1,519 0.2% -41.2% FAW 159 0.2% 35.9% 1,166 0.1% 37.7% Nissan 100 0.1% -57.1% 1,041 0.1% -24.4% XPeng 323 0.3% -% 894 0.1% -% JETOUR 156 0.2% -% 863 0.1% -% DFSK...
Automotive Sales Data Updated at: 2026/02/12
China - New car sales in 2025 by OEM, model, vehicle type
by make (shipped from the local plant) to be released later on our data for monthly sales volume.This is due to the difference in calculation methods. Passenger Car retail sales by Chinese Makers Top10 - Maker Dec. 2025 (10,000) Y-o-Y 1 BYD Auto 34.0 -15.7% 2 Geely Automobile 19.7 5.9% 3 FAW-VW 14.3 -10.8% 4 Chery Automobile 12.0 -40.6% 5 Changan Automobile 11.0 -30.3% 6 SAIC VW 9.7 -35.9% 7 Tesla 9.4 13.2% 8 Harmony Intellig...
Automotive Sales Data Updated at: 2026/02/10
South Africa - New car sales in 2025 by OEM, vehicle type
ales represented a 10.4% decrease and bus sales represented increased 1.2%.Among passenger vehicle and LCV sales manufacturers in December, Toyota sold 12,683 units (27.1% share), VW sold 4,986 units (10.6% share) and Suzuki sold 4,961 units (10.6% share).Among commercial vehicle sales in December, FAW sold 438 units (20.8% share), Isuzu sold 267 units (12.7% share), and Toyota sold 250 units (11.9% share).Sales to dealers accounted for 90.8%, to...
Automotive Sales Data Updated at: 2026/02/03
South Africa - New car sales in 2024 by OEM, vehicle type
le and LCV sales manufacturers in December, Toyota sold 11,004 units (28.3% share), VW sold 4,785 units (12.3% share) and Suzuki sold 4,514 units (11.6% share).Among commercial vehicle sales in December, Toyota sold 418 units (17.7% share), Daimler Trucks and Buses sold 382 units (16.2% share), and FAW sold 274 units (11.6% share).Sales to dealers accounted for 88.4%, to car rental agencies 8.1%, to governments 2.1%, and to corporate fleets 1.4% ...
Automotive Sales Data Updated at: 2025/07/03
Indonesia - New car sales in 2024 by OEM
5% -42.5% 3,756 0.4% -31.7% Lexus 156 0.2% -49.7% 2,584 0.3% 2.7% UD Trucks 121 0.2% 26.0% 1,960 0.2% 8.9% Nissan 233 0.3% 187.7% 1,377 0.2% -16.0% Citroen 120 0.2% -% 1,324 0.2% -% Aion 84 0.1% -% 1,240 0.1% -% Kia 18 0.0% -83.2% 1,050 0.1% -23.8% MINI 100 0.1% -14.5% 930 0.1% 2.2% FAW 117 0.1% 254.5% 847 0.1% 37.3% DFSK 17 0.0% -90.9% 828 0.1% -39.1% Ford 60 0.1% -% 817 0.1% -% Tank 89 0.1% -% 692 0.1% -% Neta 52 0.1% -3...
Automotive Sales Data Updated at: 2025/07/02
China - New car sales in 2024 by OEM, model, vehicle type
lant) to be released later on our data for monthly sales volume. This is due to the difference in calculation methods. Passenger Car retail sales by Chinese Makers Top10 - Maker Dec. 2024 (10,000) Y-o-Y 1 BYD Auto 40.3 34.3% 2 Chery Automobile 19.9 77.3% 3 Geely Automobile 18.6 46.9% 4 FAW-VW 16.1 -24.8% 5 Changan Automobile 15.7 25.0% 6 SAIC VW 15.1 2.8% 7 SAIC-GM-Wuling 12.8 22.2% 8 FAW Toyota 9.7 13.2% 9 Great Wall 8.6 2...
Automotive Sales Data Updated at: 2025/07/02
Belgium - Flash report, Automotive sales volume, 2023
Allied Vehicles 4 0.00% 1 0.00% 300.00% Forthing 4 0.00% - -% -% Maxus 4 0.00% - -% -% DFSK 2 0.00% 15 0.10% -86.70% Ferrari 2 0.00% 6 0.00% -66.70% Fisker 2 0.00% - -% -% Mitsubishi 2 0.00% - -% -% SWM 2 0.00% - -% -% Aston Martin 1 0.00% 1 0.00% 0.00% Caterham 1 0.00% - -% -% FAW 1 0.00% - -% -% Lamborghini 1 0.00% - -% -% Mclaren 1 0.00% - -% -% NIO 1 0.00% - -% -% XPeng 1 0.00% - -% -% Bentley - -% 2 0.00% -% ...
Automotive Sales Data Updated at: 2025/06/04
South Africa - Flash report, Automotive sales volume, 2023
.1% Ferrari 4 0.0% Dec.2023 Total 37,787 - Dec.2022 Total 39,221 - Y-o-Y -3.7% - Commercial Maker/Brand Dec. 2023 Share Daimler Trucks and Buses 563 22.1% Isuzu 316 12.4% Toyota 261 10.3% Volvo 257 10.1% Scania 203 8.0% Iveco 153 6.0% UD Trucks 152 6.0% MAN 130 5.1% FAW 128 5.0% Mercedes-Benz * 109 4.3% Tata 72 2.8% Powerstar 49 1.9% Ford 48 1.9% VW 45 1.8% Sinotruk 15 0.6% JAC 13 0.5% DAF 12 0.5% ...
Automotive Sales Data Updated at: 2025/06/04
Russia - Flash report, Automotive sales volume, 2023
Cheryexeed N/A -% N/A -% -% 43,071 4.6% 13,686 2.0% 214.7% UAZ 4,880 6.9% 10,753 16.8% -54.6% 37,412 4.0% 33,906 4.9% 10.3% Tank 2,539 3.6% - -% -% 13,941 1.5% - -% -% Kia 808 1.1% 2,858 4.5% -71.7% 12,005 1.3% 66,095 9.6% -81.8% Changan N/A -% 713 1.1% -% 11,267 1.2% 5,627 0.8% 100.2% FAW 630 0.9% 117 0.2% 438.5% 10,203 1.1% 2,254 0.3% 352.7% Sollers 1,011 1.4% 14 0.0% 7121.4% 8,541 0.9% 14 0.0% 60907.1% Great Wall 914 1.3% 381 ...
Automotive Sales Data Updated at: 2025/06/04
Indonesia - Flash report, Automotive sales volume, 2023
237.0% 2,515 0.3% 143.5% UD Trucks 96 0.1% -38.1% 1,799 0.2% -9.7% Nissan 81 0.1% -50.6% 1,639 0.2% -32.1% Kia 107 0.1% 3.9% 1,378 0.1% -33.9% DFSK 187 0.2% -40.3% 1,360 0.1% -43.6% MG 94 0.1% -20.3% 1,183 0.1% 21.5% MINI 117 0.1% 172.1% 910 0.1% 30.0% Scania 28 0.0% -% 714 0.1% -% FAW 33 0.0% 175.0% 617 0.1% 223.0% Subaru 38 0.0% 22.6% 561 0.1% 162.1% Jeep 6 0.0% -% 334 0.0% -% VW 10 0.0% -50.0% 247 0.0% -38.7% Peugeot 7...
Automotive Sales Data Updated at: 2025/06/04
China - Flash report, Automotive sales volume, 2023
y differ from the sales volume by make (shipped from the local plant) to be released later on our data for monthly sales volume.This is due to the difference in calculation methods. Passenger Car retail sales by Chinese Makers Top10 - Maker Dec. 2023 (10,000) Y-o-Y 1 BYD Auto 30.0 34.2% 2 FAW-VW 21.3 18.3% 3 SAIC VW 14.7 2.2% 4 Geely Automobile 12.9 2.1% 5 Changan Automobile 12.4 -26.8% 6 Chery Automobile 11.2 36.6% 7 SAIC-GM-...
Automotive Sales Data Updated at: 2025/06/04
Russia - Flash report, Automotive sales volume, 2022
2.4% -99.8% 8,451 1.2% 27,699 1.7% -69.5% Ford LCV 261 0.4% 3,101 2.4% -91.6% 6,186 0.9% 20,840 1.3% -70.3% Changan 713 1.1% 601 0.5% 18.6% 5,627 0.8% 5,705 0.3% -1.4% Audi 90 0.1% 809 0.6% -88.9% 3,512 0.5% 16,404 1.0% -78.6% Peugeot 72 0.1% 1,042 0.8% -93.1% 2,482 0.4% 8,727 0.5% -71.6% FAW 117 0.2% 151 0.1% -22.5% 2,254 0.3% 3,137 0.2% -28.1% Lexus 15 0.0% 1,156 0.9% -98.7% 1,857 0.3% 19,362 1.2% -90.4% Volvo 0 0.0% 637 0.5% -100...
Automotive Sales Data Updated at: 2025/06/04
South Africa - Flash report, Automotive sales volume, 2022
orsche 128 0.3% JAC 78 0.2% Volvo 73 0.2% Subaru 62 0.2% Ferrari 4 0.0% Dec. 2022 Total 39,231 - Dec. 2021 Total 33,942 - Y-o-Y 15.6% - Commercial Maker/Brand Dec. 2022 Share Daimler Trucks and Buses 518 20.3% Isuzu 343 13.4% Mercedes-Benz * 314 12.3% Toyota 285 11.2% FAW 221 8.7% Scania 216 8.5% UD Trucks 179 7.0% Volvo 165 6.5% MAN 76 3.0% Iveco 61 2.4% Tata 50 2.0% VW 41 1.6% Hyundai 23 0.9% Eic...
Automotive Sales Data Updated at: 2025/06/04
China - Flash report, Automotive sales volume, 2022
. differ from the sales volume by make (shipped from the local plant) to be released later on our data for monthly sales volume This is due to the difference in calculation methods. Passenger Car retail sales by Chinese Makers Top10 - Maker Dec. 2022 (10,000) Y-o-Y 1 BYD Auto 22.4 128.6% 2 FAW-VW 18.0 15.5% 3 Changan Automobile 16.9 130.0% 4 SAIC VW 14.4 2.4% 5 Geely Automobile 12.6 -10.7% 6 SAIC GM 11.1 7.7% 7 FAW Toyota 10.2 ...
Automotive Sales Data Updated at: 2025/06/04
Indonesia - Flash report, Automotive sales volume, 2022
UD Trucks 155 0.1% -22.1% 1,993 0.2% 202.0% Lexus 92 0.1% 41.5% 1,033 0.1% 6.3% MG 118 0.1% 84.4% 974 0.1% -9.4% MINI 43 0.0% 104.8% 700 0.1% 6.5% Peugeot 18 0.0% -53.8% 451 0.0% 70.2% VW 20 0.0% -41.2% 403 0.0% 6.1% Subaru 31 0.0% -% 214 0.0% -% Tata 0 0.0% -100.0% 205 0.0% 18.5% FAW 12 0.0% -50.0% 191 0.0% 9.8% Audi 11 0.0% 120.0% 53 0.0% 39.5% Total 105,354 100.0% 9.0% 1,048,040 100.0% 18.1% Source:GAIKINDO Flash...
Automotive Sales Data Updated at: 2025/06/04


 Japan
Japan USA
USA Mexico
 Germany
 China (Shanghai)
 Thailand
 India
India