
 AI Navigator


Search Results by Category
 AI Navigator
All information related to {{ key_word }}.
AI Navigation will guide you. Click here for information about {{ key_word }}.
Images
 3
3
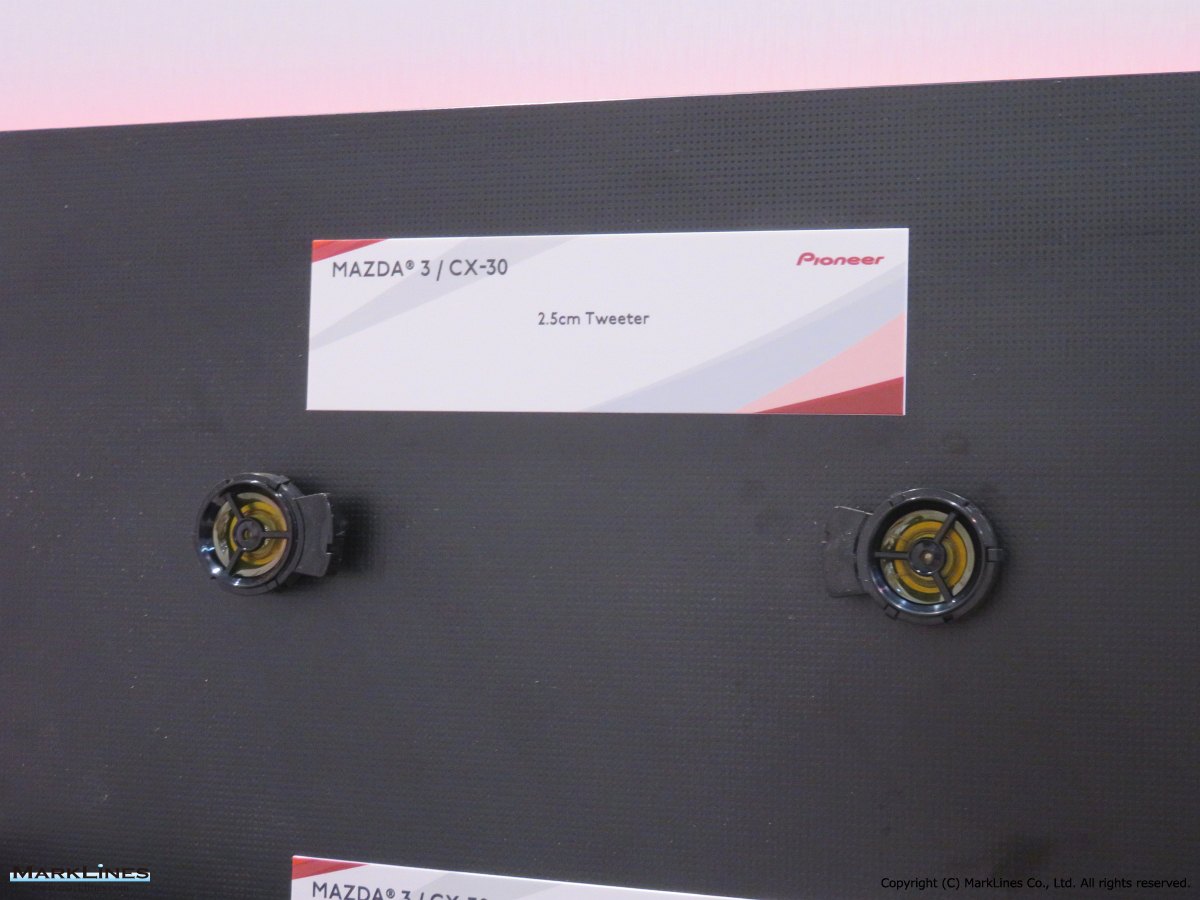
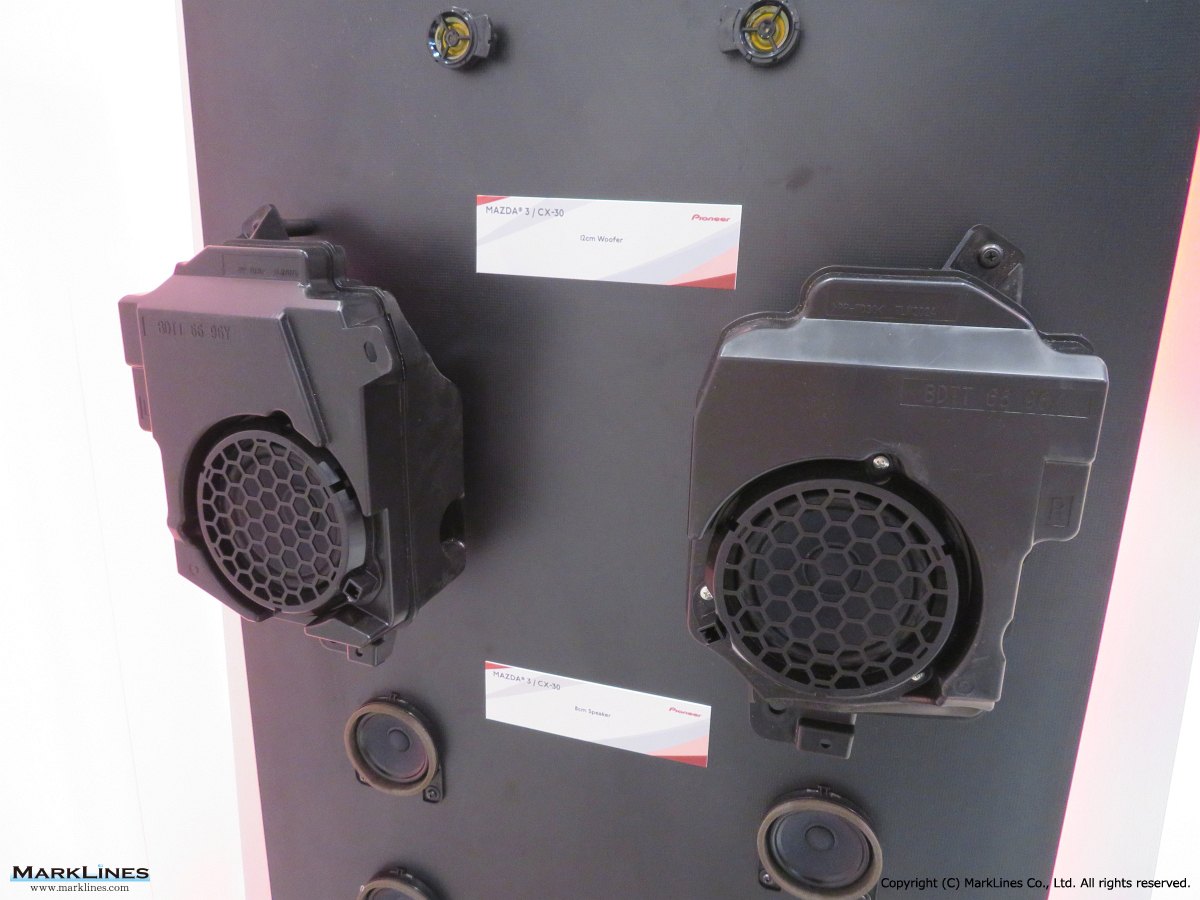
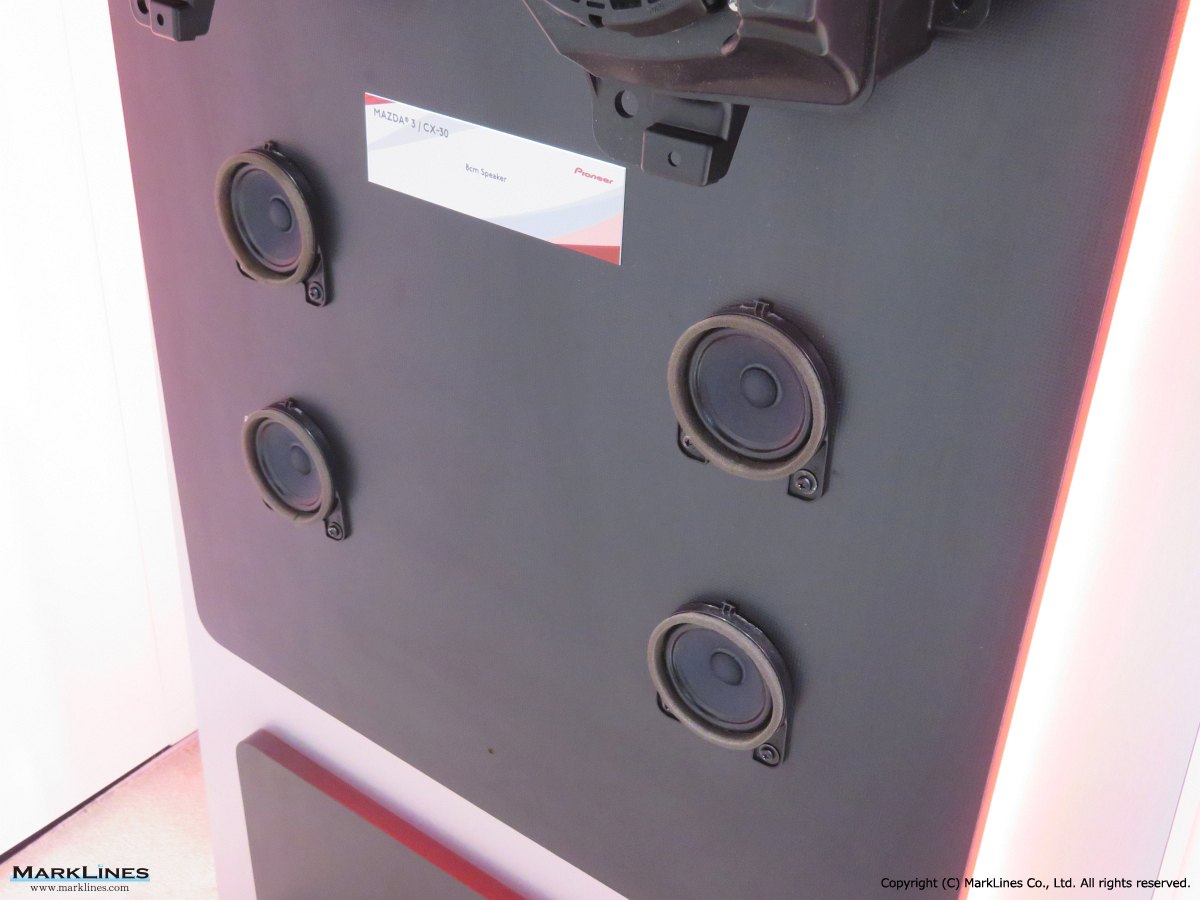
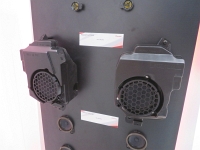
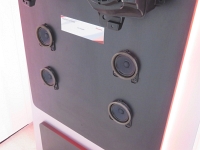
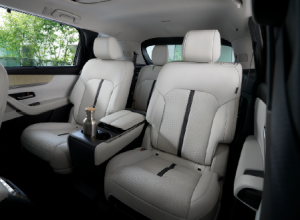
Audio system for Mazda 3/CX-30
 4
4
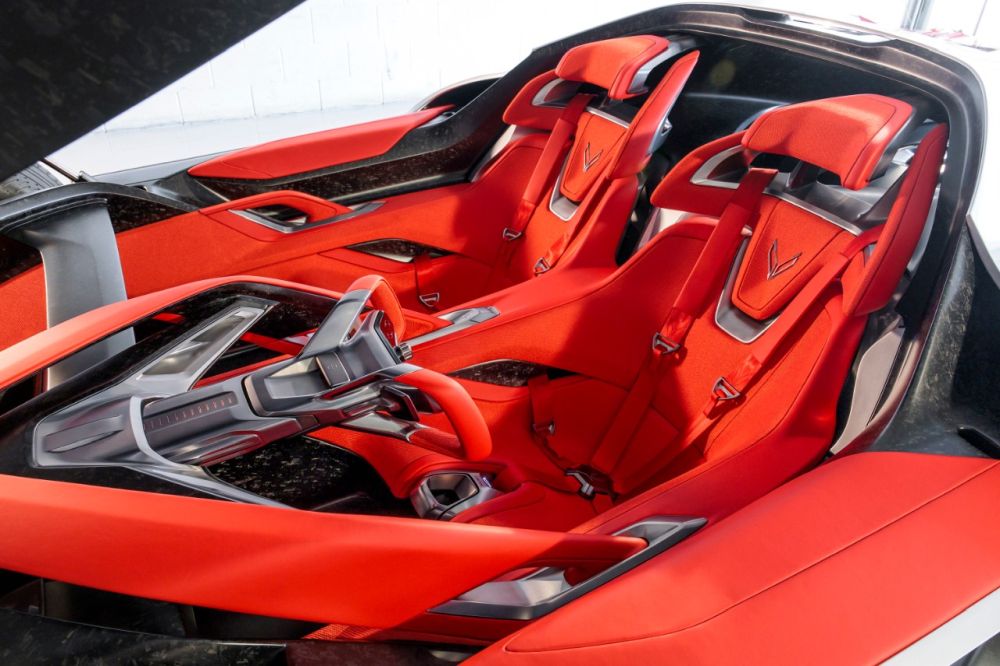
Chevrolet unveils Corvette CX and CX.R Vision Gran Turismo concepts at Monterey Car Week
 3
3
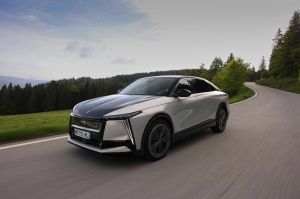
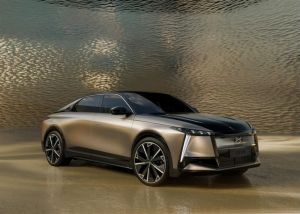
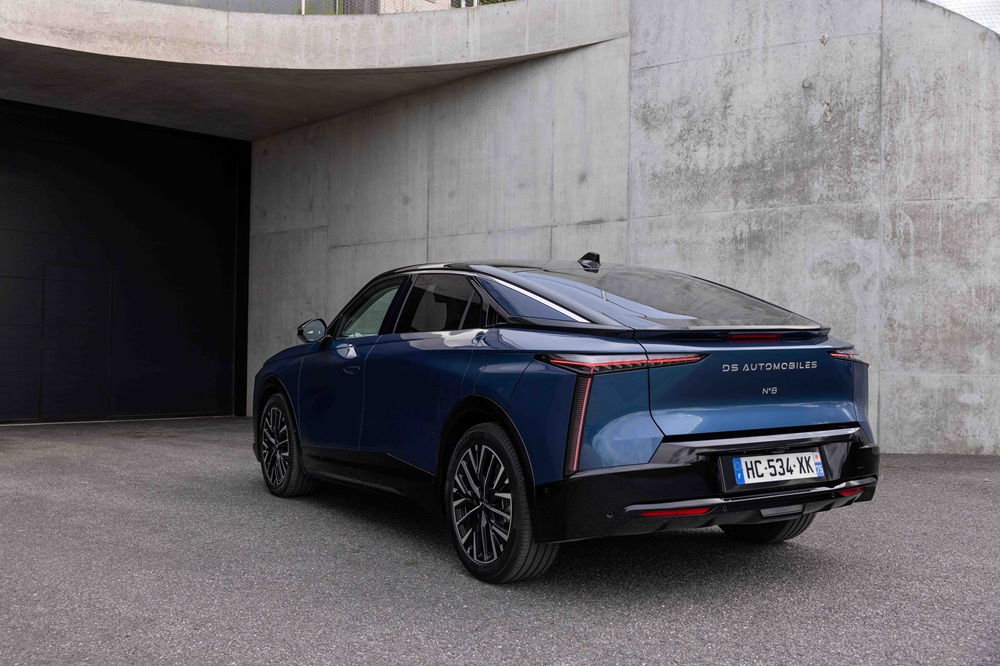
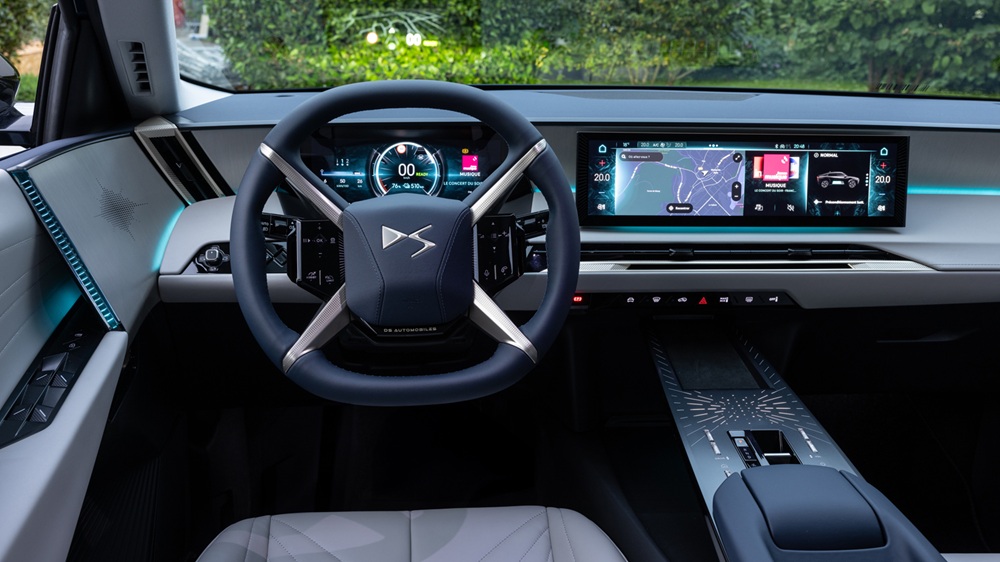
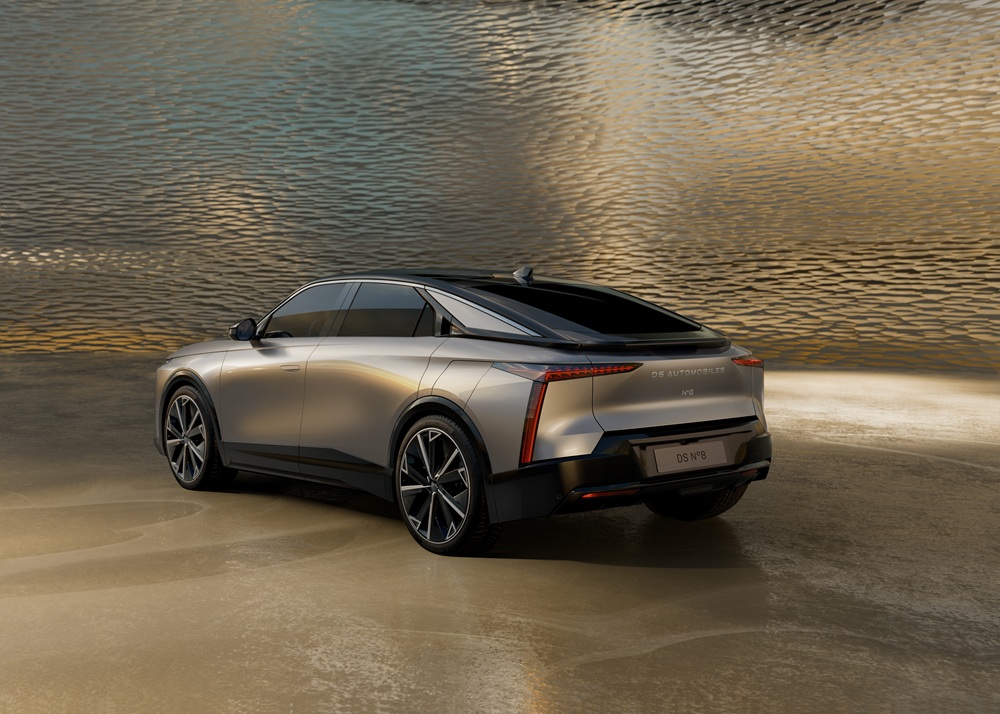
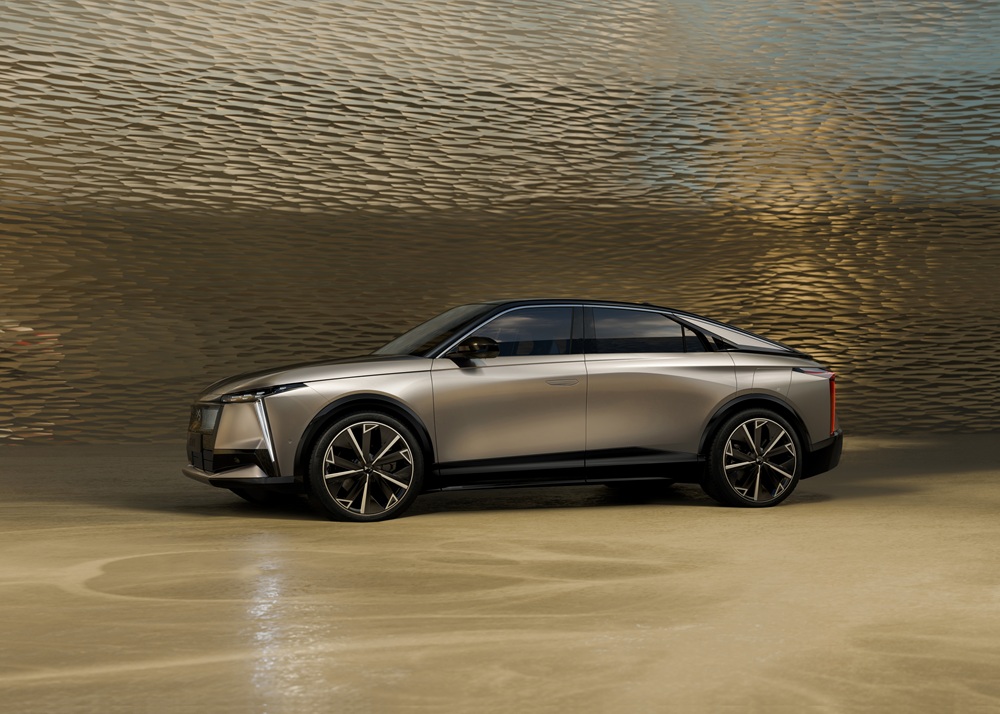
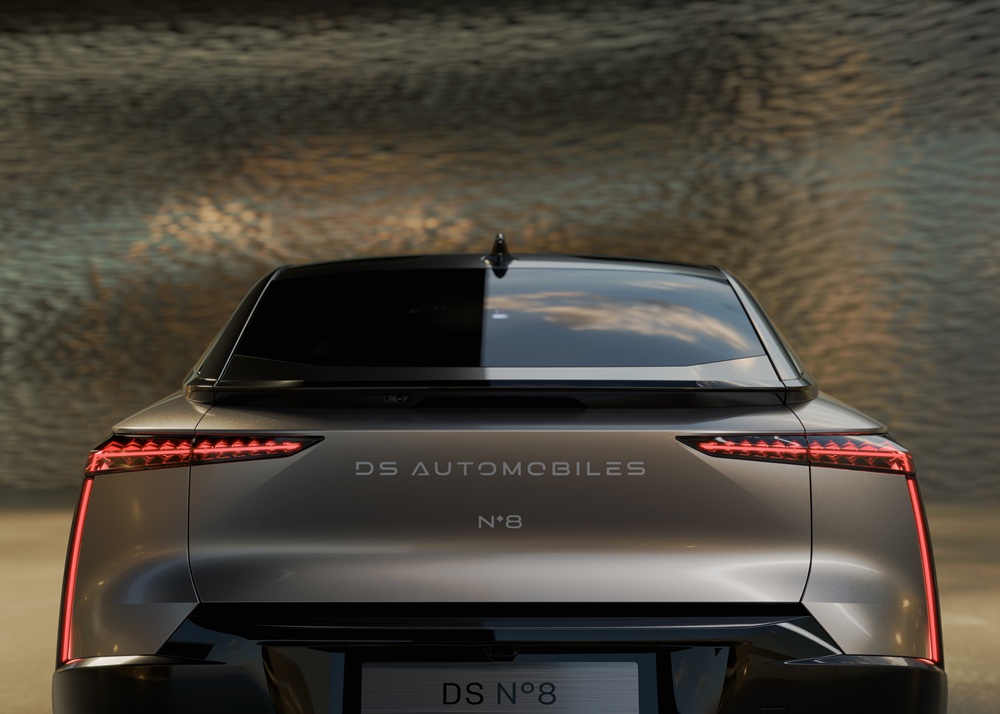
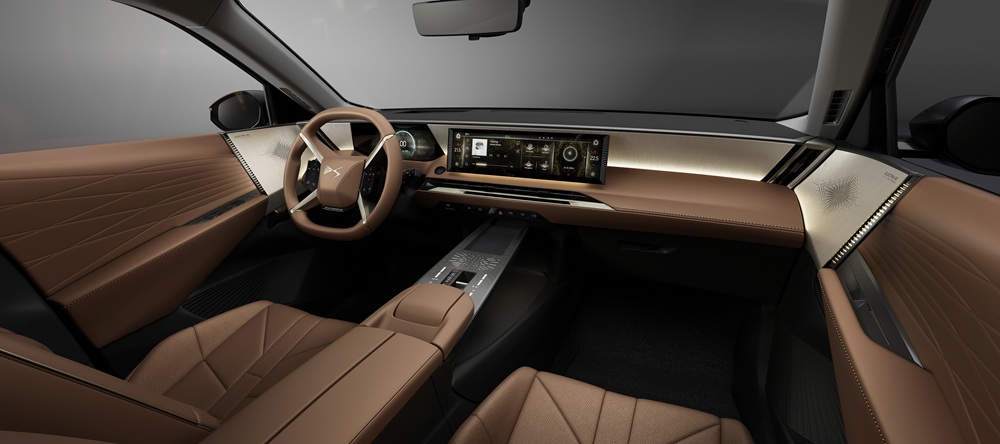
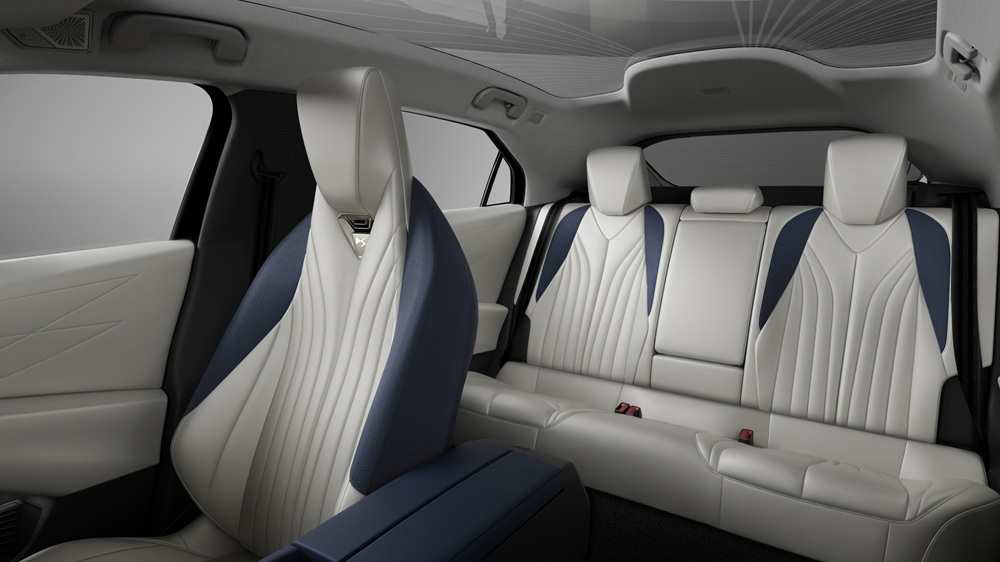
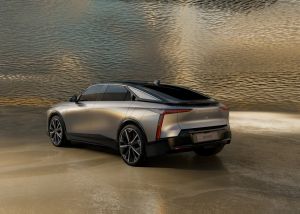
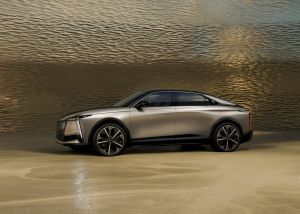
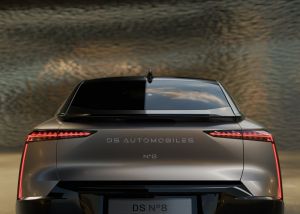
DS Automobiles launches all-electric DS N°8 for Türkiye market in late 2025
 4
4
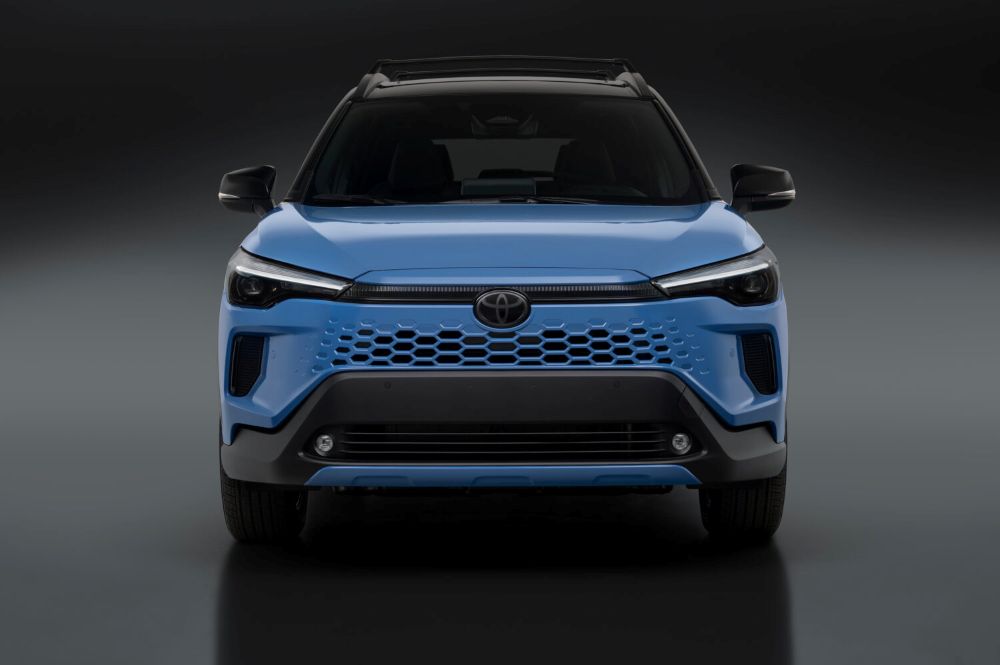
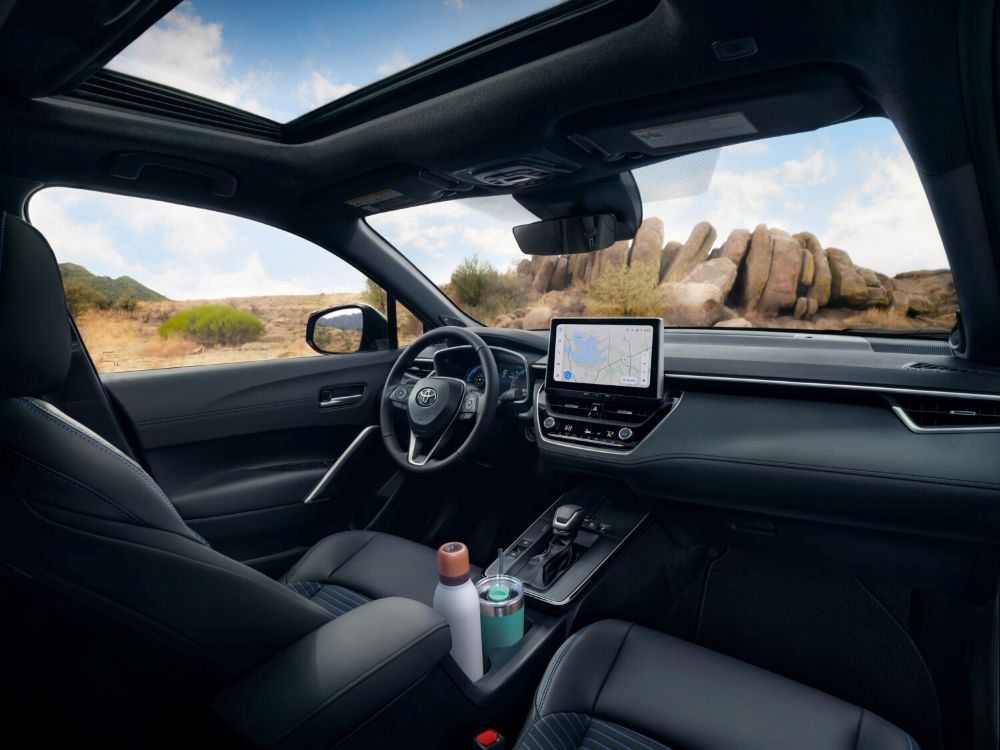
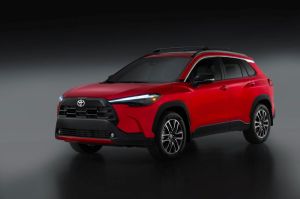
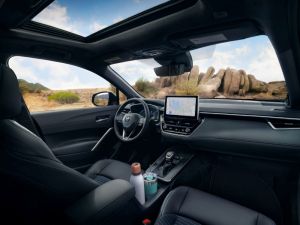
Toyota debuts 2026 Corolla Cross with fresh style in U.S.
 3
3
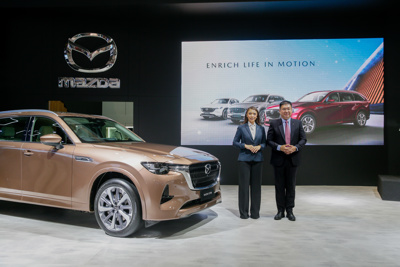
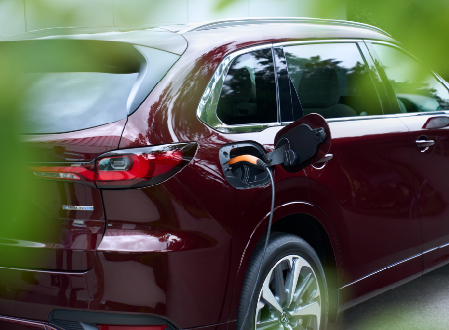
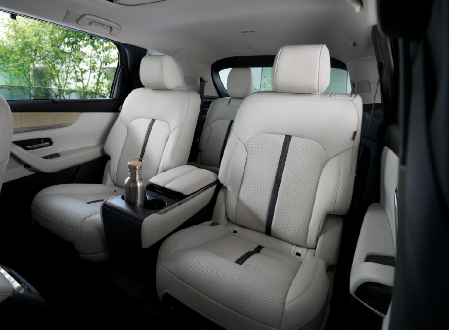
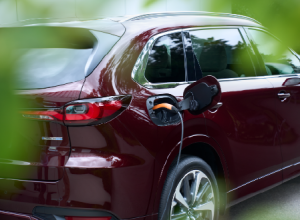
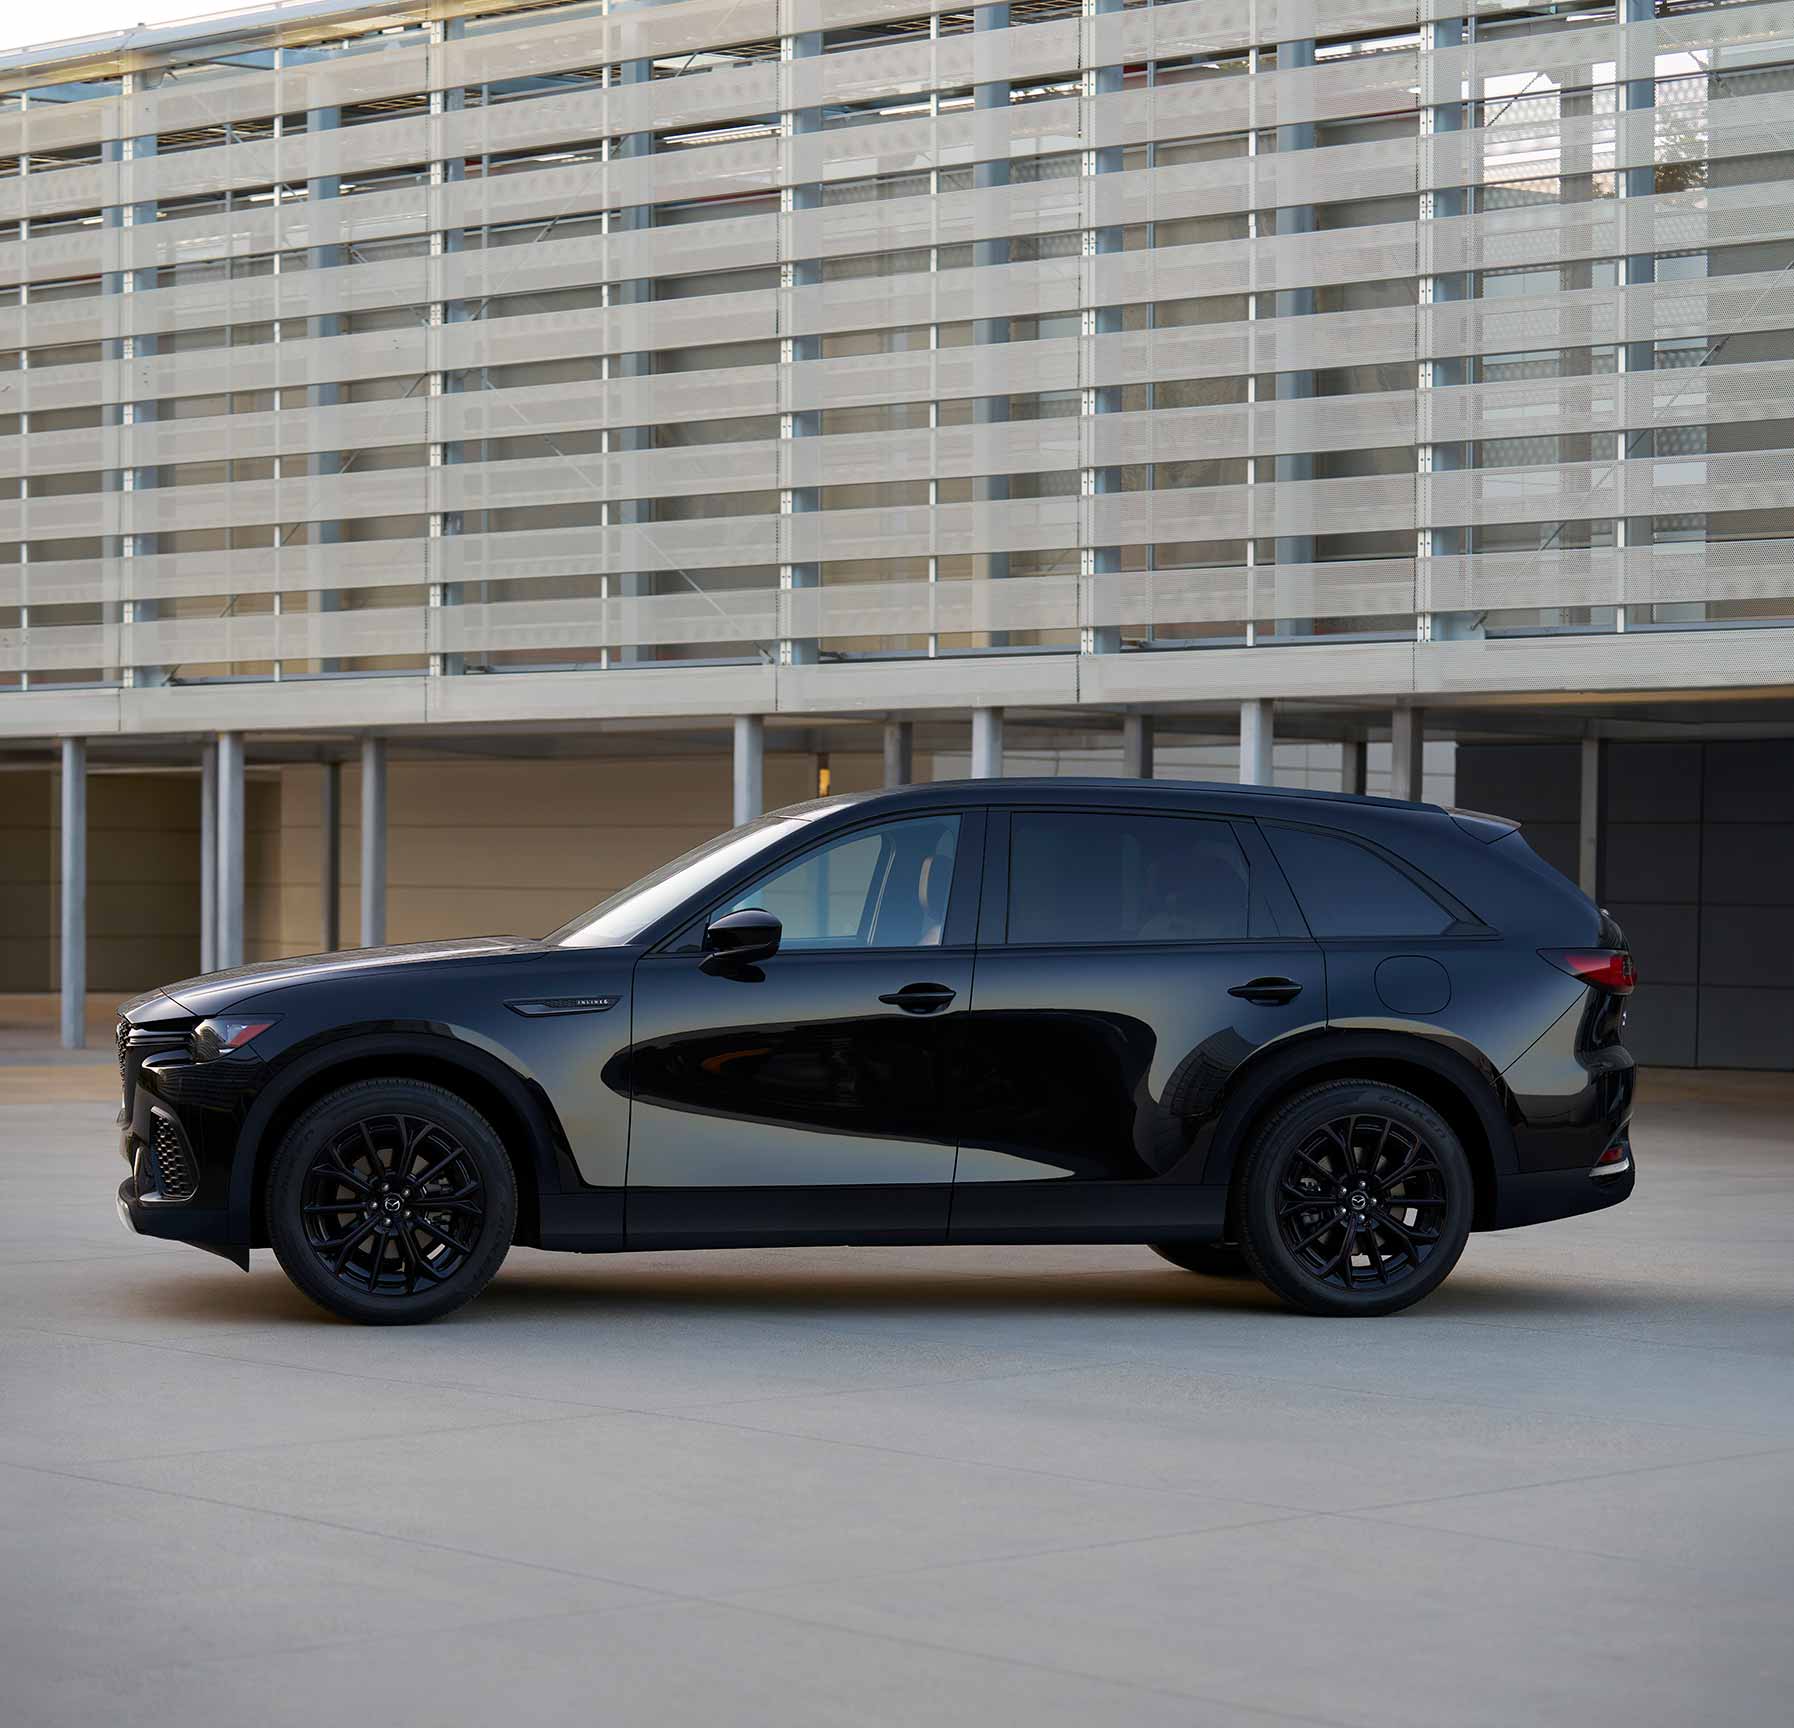
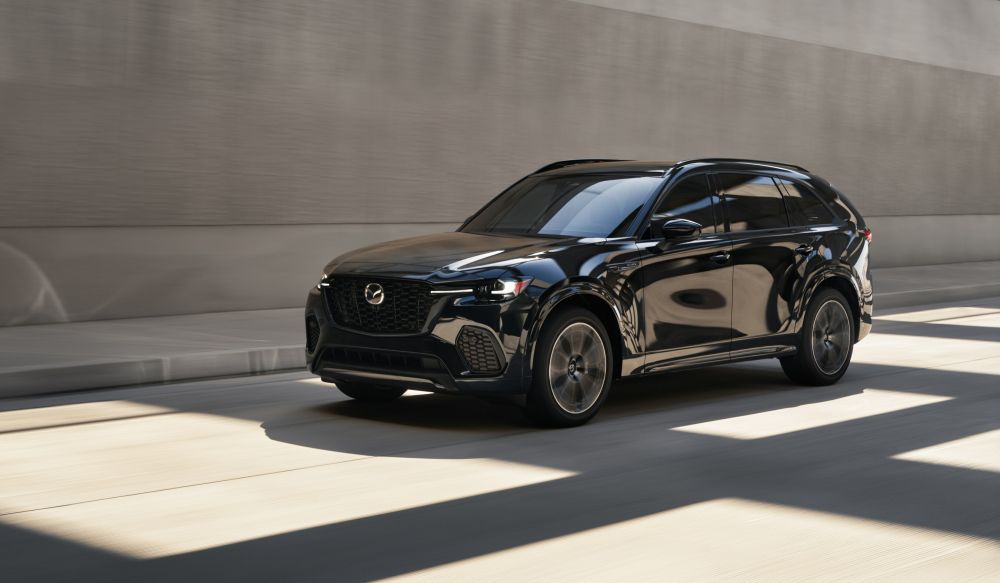
IIMS 2025: Mazda Indonesia presents recently launched all-new CX-80 PHEV
_thumbnail.jpg) 1
1
Singapore Motorshow 2025 features over 160 vehicles from 31 auto brands
 6
6
Stellantis unveils first all-electric DS N°8
_thumbnail.jpg) 3
3
VMS 2024: Skoda presents various models including EV in Vietnam
 1
1
Mazda CX-70 arrives in Mexico
 1
1
Mazda announces packaging for all-new 2025 Mazda CX-70 in U.S.
Sort by :
1 - 9 of 9 results
USA - New car sales in 2025 by OEM, model, vehicle type
ales disruptions from the global semiconductor shortage linked to China-backed Dutch chipmaker Nexperia, as well as a fire at Novelis’s New York plant, which constrained aluminum supplies.By vehicle type, November light truck sales fell 4.5% y/y to 1,071,593 units, while passenger cars dropped 16.8% y/y to 203,031 units.Total inventory at the start of November stood at 3.14 million units, up from 2.8 million a month earlier, with days’ supply...
Automotive Sales Data Updated at: 2025/12/09
Australia - Flash report, Automotive sales volume, 2022
ot match up for reasons including different information sources, and discrepancies between preliminary reports and confirmed data.Australian new vehicle sales up 12.1% in December, up 3.0% in 2022 On January 5, the Federal Chamber of Automotive Industries announced that new vehicle registrations of 87,920 units in December 2022 represented an increase 12.1% over December 2021.New vehicle sales of 1,081,429 units in 2022 represented an 3.0% increa...
Automotive Sales Data Updated at: 2025/06/04
USA - Flash report, Automotive sales volume, 2022
USA - Flash report, Automotive sales volume, 2022 Flash report, Automotive sales volume, 2022 Jan. Feb. Mar. Apr. May Jun. Jul. Aug. Sep. Oct. Nov. Dec. Flash report, Dec 2022 Jan 5, 2023 U.S. car sales up 5.4% in December, down 7.8% for full-year 2022※Sales figures of Mercedes Benz and Porche have been updated. January 11, 2023U.S. light vehicle sales in December of 1,287,280 units were up 5.4% as compared to the same month in 2021.Truck and ...
Automotive Sales Data Updated at: 2025/06/04
China - Flash report, Sales volume, 2018
China - Flash report, Sales volume, 2018 Flash report, Sales volume, 2018 Jan. Feb. Mar. Apr. May Jun. Jul. Aug. Sep. Oct. Nov. Dec. Flash report, December 2018 7 Jan. 2019 *There are cases where recently released data and detailed information in the database do not match up for reasons including different information sources, and discrepancies between preliminary reports and confirmed data. China vehicle sales in 2018 reach 28,081,000 units, do...
Automotive Sales Data Updated at: 2019/01/31
China - Flash report, Sales volume, 2017
China - Flash report, Sales volume, 2017 Flash report, Sales volume, 2017 Jan. Feb. Mar. Apr. May Jun. Jul. Aug. Sep. Oct. Nov. Dec. Flash report, December 2017 4 Jan. 2018 *There are cases where recently released data and detailed information in the database do not match up for reasons including different information sources, and discrepancies between preliminary reports and confirmed data. China vehicle sales in 2017 reach 28,879,000 units, up...
Automotive Sales Data Updated at: 2018/07/24
Australia - Flash report, Sales volume, 2013
report, December 2013 7 Jan. 2014 *Data in the flash report may from time to time differ from data in the detail report to be announced at a later date due to a difference in the data source. New vehicle sales by type Type Dec. 2013 Dec. 2012 Y-o-Y Jan.-Dec.2013 Jan.-Dec.2012 Y-o-Y PC 47,686 50,496 -5.6% 566,454 575,427 -1.6% SUV 28,543 25,670 11.2% 333,511 307,253 8.5% LCV 17,809 16,439 8.3% 204,566 ...
Automotive Sales Data Updated at: 2016/05/02
Mexico - Flash report, Sales volume, 2014
er 2014 6 Jan. 2015 *Data in the flash report may from time to time differ from data in the detail report to be announced at a later date due to a difference in the data source. Sales of new vehicles by type(including import cars) 2014Dec. 2013Dec. Y-o-Y 2014Jan.-Dec. 2013Jan.-Dec. Y-o-Y Cars 87,096 76,061 14.5% 745,250 698,217 6.7% Light Trucks 46,177 43,303 6.6% 390,159 365,146 6.9% Total 133,273 119,364 11.7% 1,135,409 1,063,363 6.8%...
Automotive Sales Data Updated at: 2015/01/14
Australia - Flash report, Sales volume, 2014
flash report may from time to time differ from data in the detail report to be announced at a later date due to a difference in the data source. New vehicle sales by type Type Dec. 2014 Dec. 2013 Y-o-Y Jan.-Dec.2014 Jan.-Dec.2013 Y-o-Y PC 45,051 47,675 -5.5% 531,596 566,404 -6.1% SUV 30,666 28,554 7.4% 352,347 333,561 5.6% LCV 18,239 17,809 2.4% 197,956 204,566 -3.2% HCV 2,853 2,718 5.0% 31,325 31,696 -1.2% Total 96,809 96,756 0.1% 1...
Automotive Sales Data Updated at: 2015/01/07
Mexico - Flash report, Sales volume, 2013
ata in the flash report may from time to time differ from data in the detail report to be announced at a later date due to a difference in the data source. Sales of new vehicles by type(including import cars) 2013Dec. 2013Dec. Y-o-Y 2013Jan.-Dec. 2012Jan.-Dec. Y-o-Y Cars 76,061 73,106 4.0% 698,217 649,333 7.5% Light Trucks 43,303 37,743 14.7% 365,146 338,414 7.9% Total 119,364 110,849 7.7% 1,063,363 987,747 7.7% Source: Asociacion M...
Automotive Sales Data Updated at: 2014/04/24


.jpg)


.jpg)
.jpg)
.jpg)
_thumbnail.jpg)
_thumbnail.jpg)
 Japan
Japan USA
USA Mexico
 Germany
 China (Shanghai)
 Thailand
 India
India