


Search Results by Category
All information related to {{ key_word }}.
AI Navigator will guide you. Click here for information about {{ key_word }}.
Images
 1
1
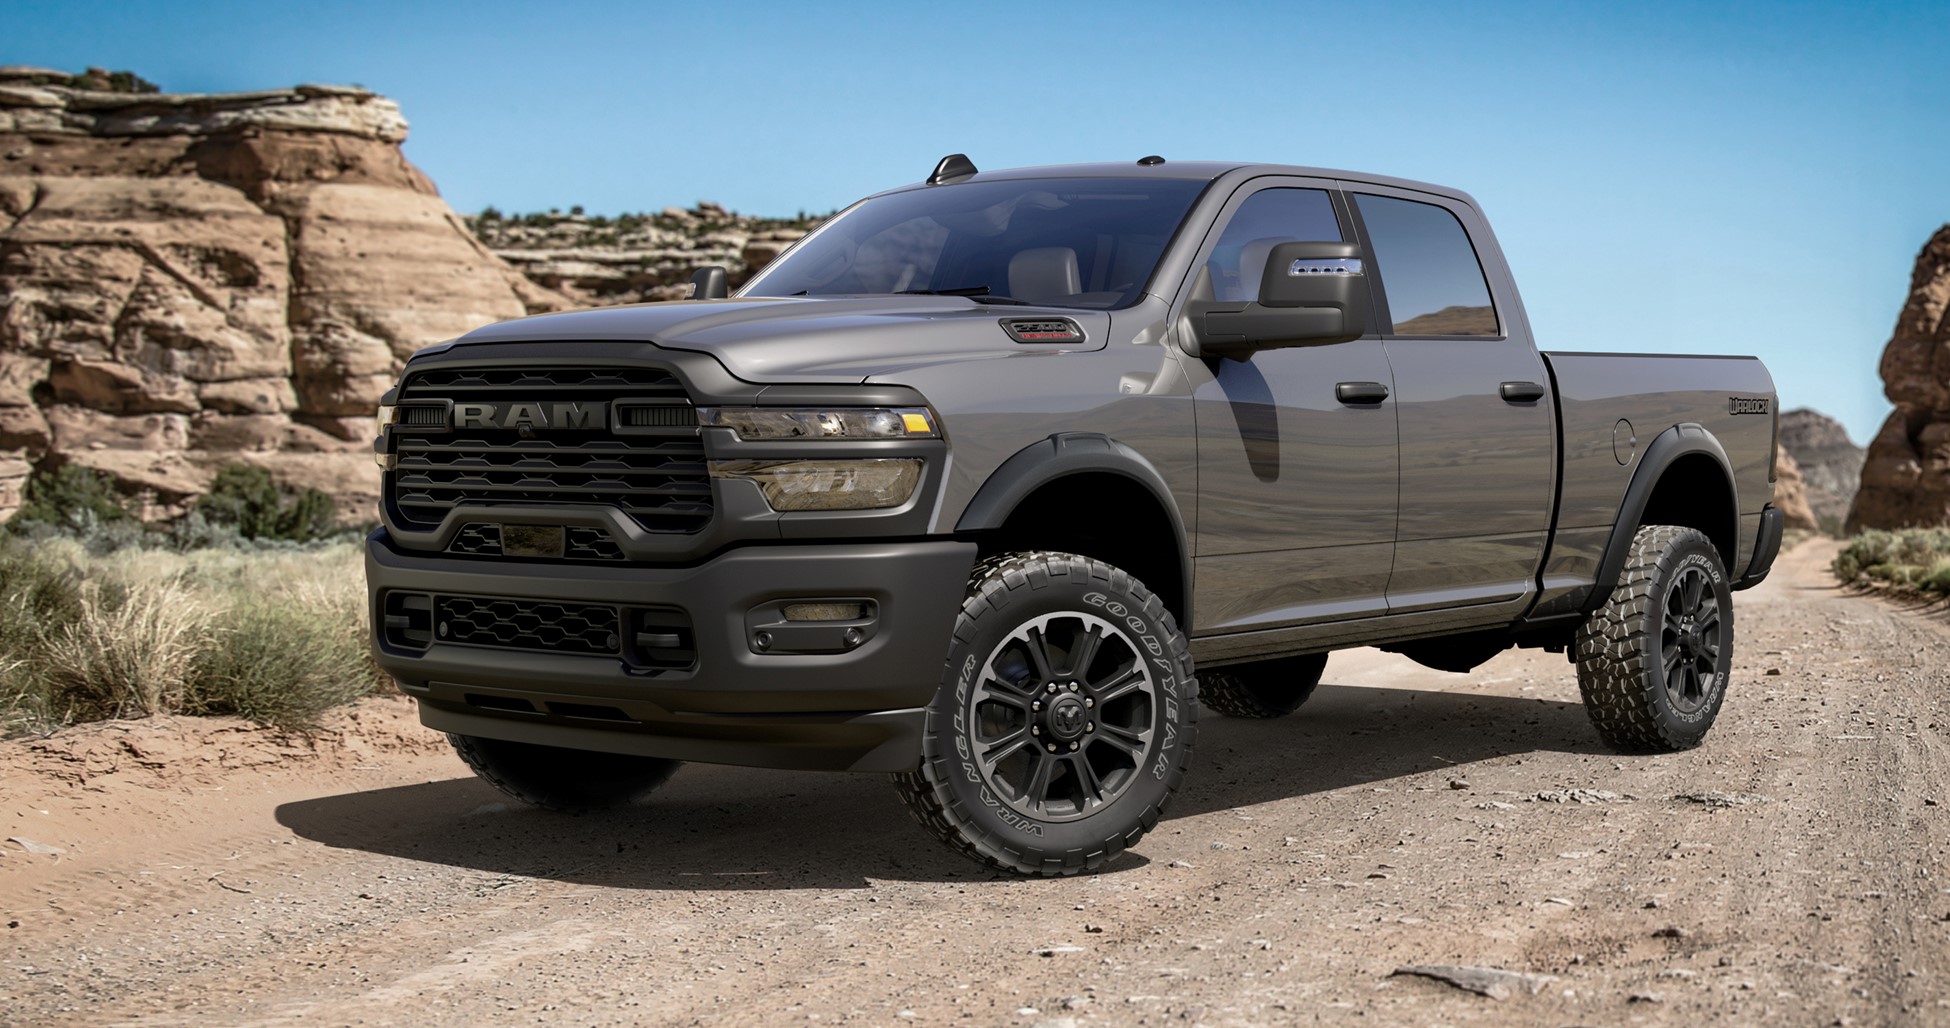
Stellantis debuts heavy-duty 2027 Ram 2500 Emergency Response Vehicle
 4
4
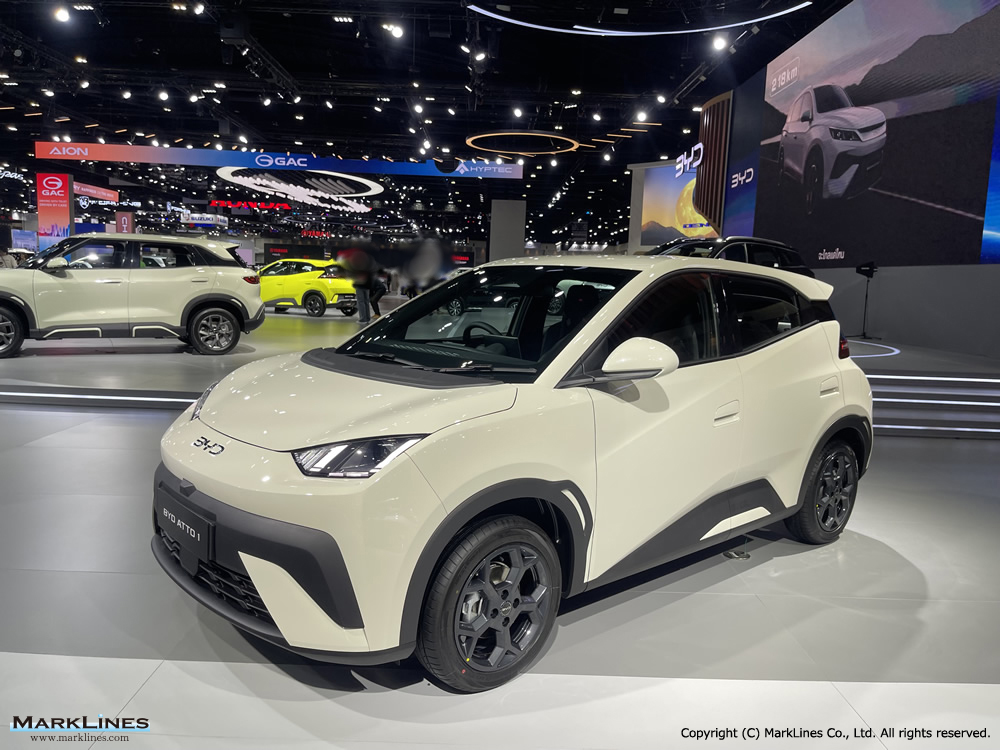
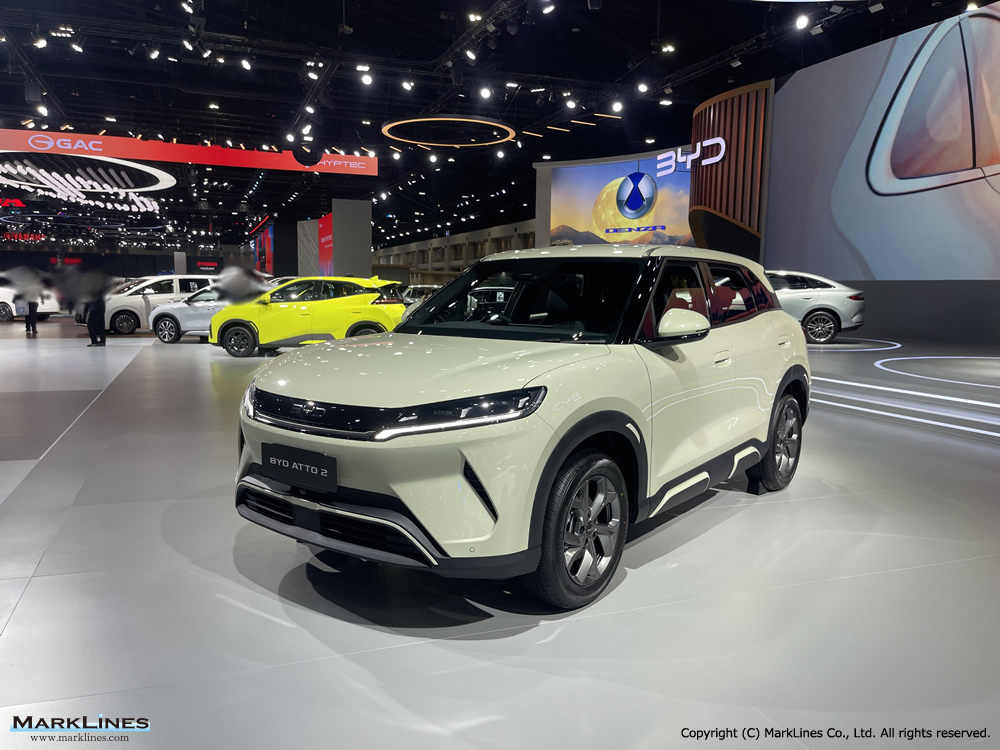
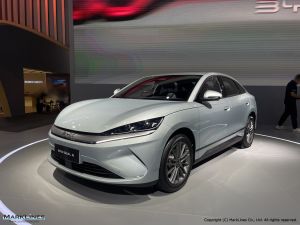
BIMS 2026: BYD launches ATTO 1, ATTO 2, SEAL 6, and SEALION 5 DM-I in Thailand
 4
4
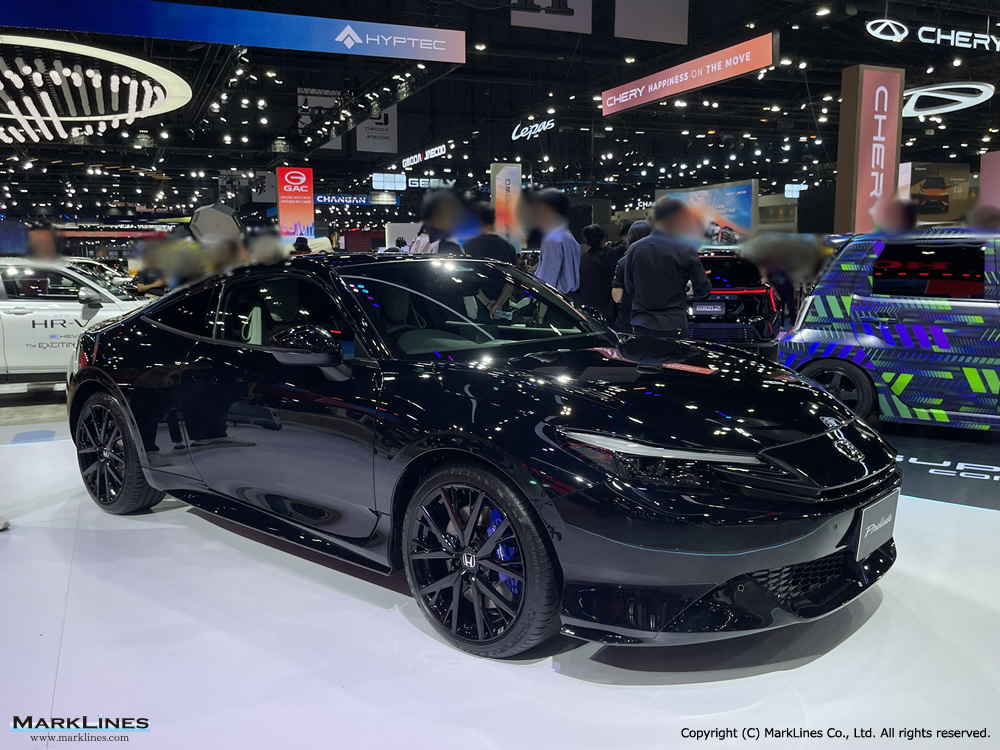
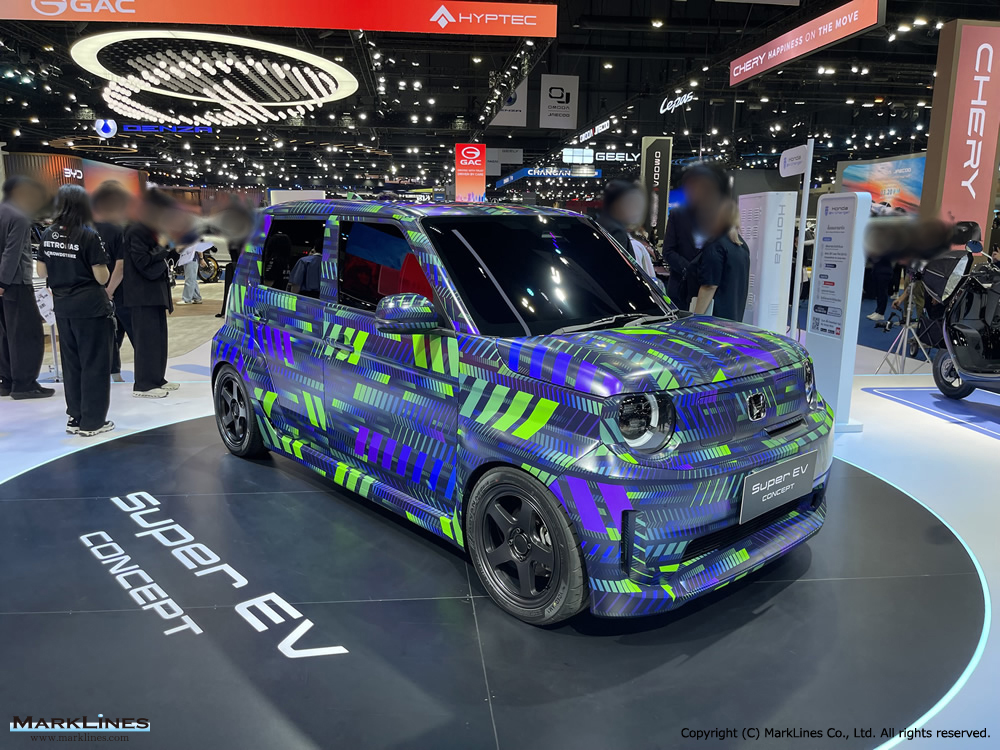
BIMS 2026: Honda announces e:N2 pricing; 6th-gen Prelude, Super EV Concept on display in Thailand
 1
1
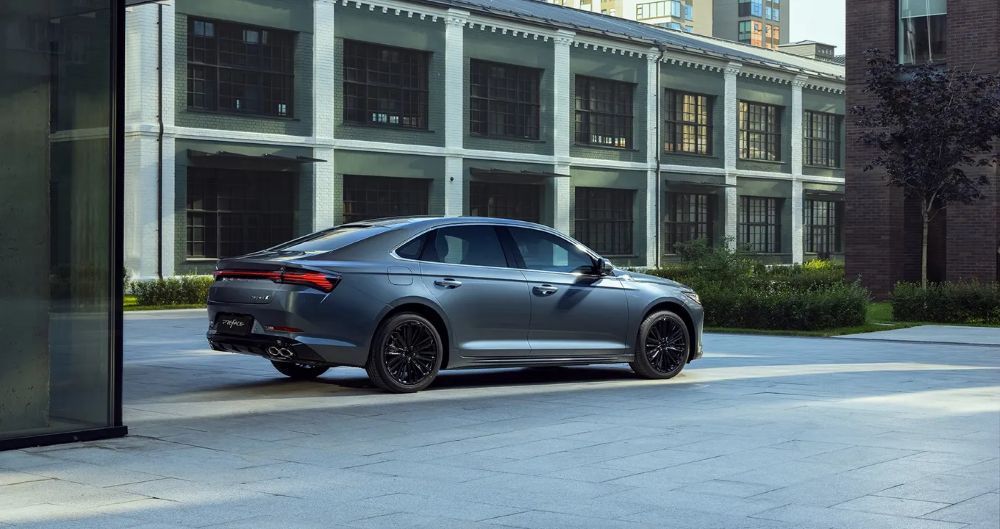
Geely launches updated Preface model in Russia
 2
2
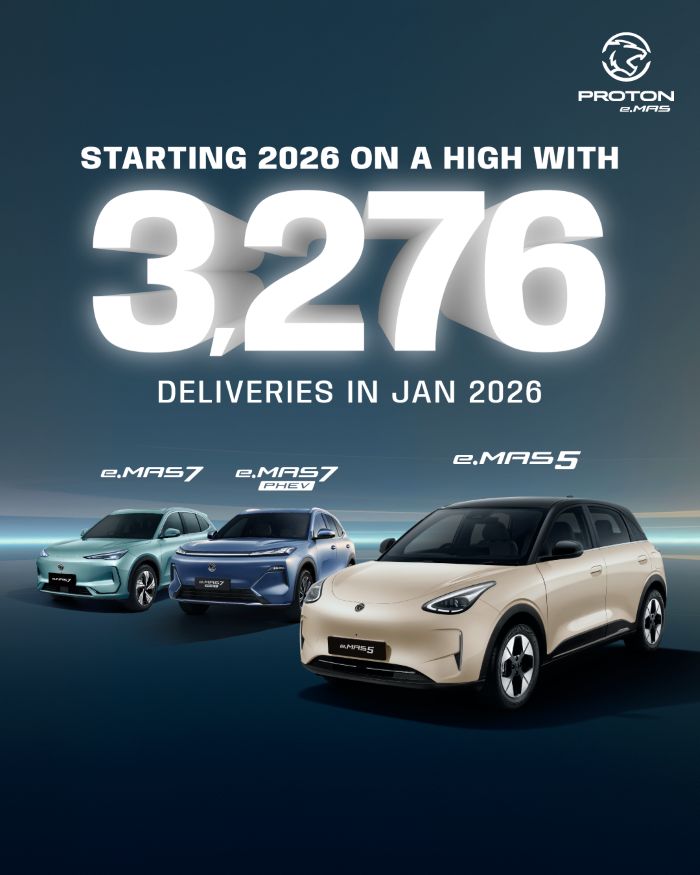
Proton’s January 2026 group sales soar to 19,833 units, best month in 15 years
 1
1
Santana Motors, Spain unveils new 400 PHEV and 400D pickups
 1
1
Al-Futtaim BYD launches BYD Shark 6 plug-in hybrid pickup in UAE
 4
4
Chery Jetour starts accepting pre-orders for Zongheng G700 plug-in hybrid electric SUV
 2
2
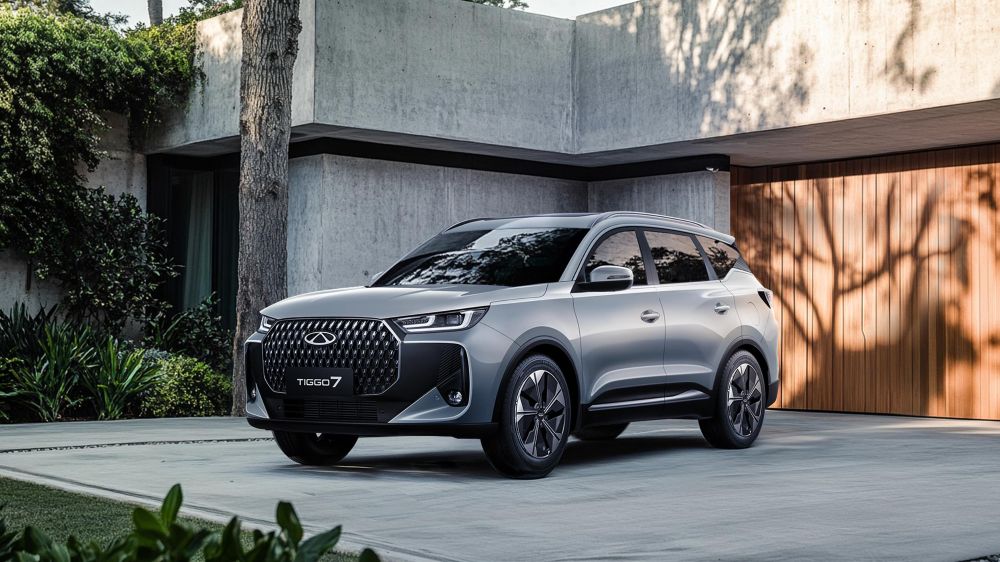
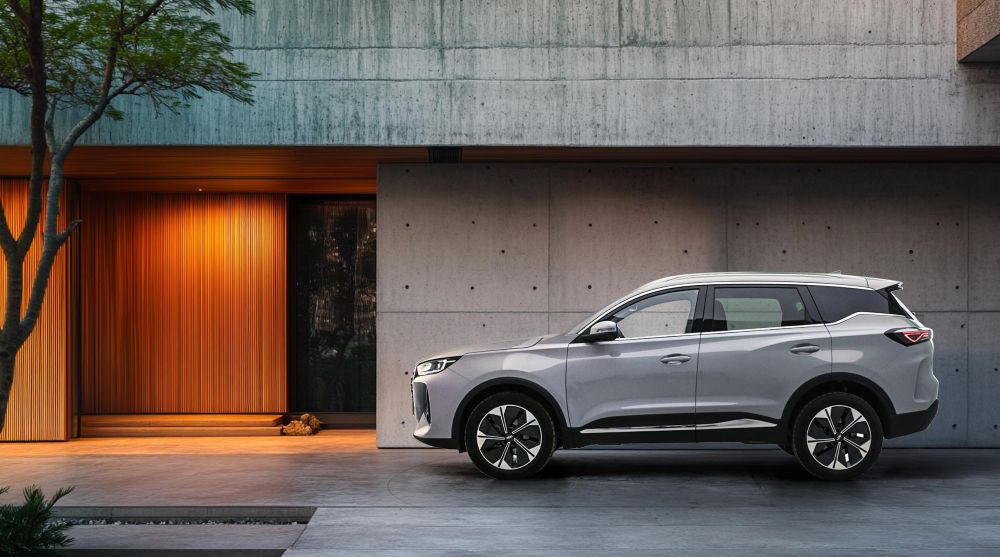
Chery South Africa unveils updated Tiggo 7 range
 1
1
Ram expands Ram 2500 Heavy Duty sport truck offerings for 2026
Sort by :
1 - 20 of 359 results
Sweden - New car sales in 2026 by OEM
n.-May Share Volvo 5,150 19.8% 5,002 19.5% 3.0% 19,031 17.0% 21,138 18.6% -10.0% VW 3,099 11.9% 3,386 13.2% -8.5% 13,439 12.0% 16,554 14.6% -18.8% Kia 2,214 8.5% 1,790 7.0% 23.7% 8,892 7.9% 7,436 6.6% 19.6% Toyota 2,030 7.8% 2,076 8.1% -2.2% 9,320 8.3% 8,849 7.8% 5.3% Skoda 1,644 6.3% 1,429 5.6% 15.0% 7,187 6.4% 6,688 5.9% 7.5% Mercedes 1,472 5.7% 1,661 6.5% -11.4% 7,198 6.4% 6,850 6.0% 5.1% BMW 1,440 5.5% 1,290 5.0% 11.6% 6,877 6...
Automotive Sales Data Updated at: 2026/06/01
Japan - New car sales in 2026 by OEM, model, vehicle type
0 8.2% -15.7% 99,044 7.9% 112,790 9.0% -12.2% Suzuki 12,317 5.7% 12,107 5.9% 1.7% 75,664 6.1% 65,768 5.3% 15.0% Mazda 7,098 3.3% 7,420 3.6% -4.3% 48,487 3.9% 54,355 4.3% -10.8% Subaru 6,359 3.0% 6,338 3.1% 0.3% 35,401 2.8% 41,130 3.3% -13.9% Lexus 6,352 3.0% 7,072 3.5% -10.2% 33,775 2.7% 36,429 2.9% -7.3% Isuzu 4,404 2.0% 4,916 2.4% -10.4% 30,735 2.5% 30,574 2.4% 0.5% Mitsubishi 3,984 1.9% 3,440 1.7% 15.8% 23,820 1.9% 21,319 1.7% 11.7...
Automotive Sales Data Updated at: 2026/06/01
Germany - New car sales in 2026 by OEM, model, vehicle type
8% 20,786 20,773 0.1% Share 2.2% 2.1% 0.0 pt 2.2% 2.3% -0.1 pt BYD Auto Total 4,705 1,566 200.4% 13,825 2,791 395.3% Share 1.9% 0.6% 1.2 pt 1.5% 0.3% 1.1 pt Citroen Total 4,634 4,602 0.7% 17,689 16,254 8.8% Share 1.9% 1.9% 0.0 pt 1.9% 1.8% 0.1 pt Volvo Total 3,893 5,194 -25.0% 16,494 21,429 -23.0% Share 1.6% 2.1% -0.6 pt 1.7% 2.4% -0.6 pt Mazda Total 3,538 3,029 16.8% 16,368 13,649 19.9% Share 1.4% 1.2% 0.2 pt 1.7% 1.5% 0.2 pt ...
Automotive Sales Data Updated at: 2026/05/25
Mexico - New car sales in 2026 by OEM, vehicle type
-3.5% - Fiat 245 0.2% 560 0.5% -56.3% 546 0.2% 1,123 0.5% -51.4% - Alfa Romeo 22 0.0% 25 0.0% -12.0% 37 0.0% 47 0.0% -21.3% Toyota 8,116 6.9% 8,232 6.9% -1.4% 19,785 7.9% 19,208 8.0% 3.0% Ford Motor 4,243 3.6% 3,896 3.3% 8.9% 8,260 3.3% 8,132 3.4% 1.6% Honda 3,375 2.9% 3,284 2.8% 2.8% 7,429 3.0% 6,720 2.8% 10.6% Hyundai 3,365 2.8% 4,105 3.5% -18.0% 7,490 3.0% 8,084 3.4% -7.3% Geely 3,207 2.7% 919 0.8% 249.0% 6,563 2.6% 1,891 0.8% ...
Automotive Sales Data Updated at: 2026/05/12
Brazil - New car sales in 2026 by OEM, vehicle type
5% 2,111 5.4% -22.5% 3,931 5.3% 4,476 5.9% -12.2% HPE (Mitsubishi) 717 2.0% 1,354 3.5% -47.0% 1,422 1.9% 2,387 3.1% -40.4% Mercedes-Benz Cars & Vans 493 1.3% 528 1.3% -6.6% 1,017 1.4% 995 1.3% 2.2% Iveco 296 0.8% 377 1.0% -21.5% 565 0.8% 654 0.9% -13.6% PSA * 295 0.8% 277 0.7% 6.5% 565 0.8% 429 0.6% 31.7% - Peugeot 175 0.5% 190 0.5% -7.9% 361 0.5% 296 0.4% 22.0% - Citroen 120 0.3% 87 0.2% 37.9% 204 0.3% 133 0.2% 53.4% MAN 204 0....
Automotive Sales Data Updated at: 2026/05/11
Finland - New car sales in 2026 by OEM
1,211 7.2% -6.8% BMW 354 5.2% 897 5.2% 852 5.1% 5.3% Mercedes-Benz 349 5.1% 933 5.4% 823 4.9% 13.4% Nissan 305 4.5% 611 3.6% 836 5.0% -26.9% Audi 266 3.9% 739 4.3% 693 4.1% 6.6% Ford 243 3.6% 649 3.8% 697 4.2% -6.9% Hyundai 208 3.1% 399 2.3% 600 3.6% -33.5% Polestar 174 2.6% 258 1.5% 429 2.6% -39.9% Renault 157 2.3% 316 1.8% 203 1.2% 55.7% BYD Auto 103 1.5% 273 1.6% 123 0.7% 122.0% Mazda 99 1.5% 192 1.1% 225 1.3% -14.7% Peu...
Automotive Sales Data Updated at: 2026/05/07
UK - New car sales in 2026 by OEM, vehicle type
1% Geely 1,305 0.3% 0 0.0% -% 1,595 0.3% 0 0.0% -% Fiat 1,167 0.3% 2,050 0.6% -43.1% 1,612 0.3% 4,084 0.7% -60.5% Changan/Chana 540 0.1% 0 0.0% -% 753 0.1% 0 0.0% -% Alpine 474 0.1% 26 0.0% 1723.1% 712 0.1% 42 0.0% 1595.2% smart 451 0.1% 385 0.1% 17.1% 583 0.1% 487 0.1% 19.7% Alfa Romeo 429 0.1% 616 0.2% -30.4% 739 0.1% 741 0.1% -0.3% Subaru 377 0.1% 627 0.2% -39.9% 657 0.1% 825 0.1% -20.4% XPeng 331 0.1% 36 0.0% 819.4% 353 0.1% 3...
Automotive Sales Data Updated at: 2026/05/07
Denmark - New car sales in 2026 by OEM, vehicle type
1,043 7.0% 23.3% 2,571 6.2% 2,348 6.3% 9.5% RENAULT 1,037 5.5% 339 2.3% 205.9% 261 0.6% 1,283 3.4% -79.7% CUPRA 983 5.2% 892 6.0% 10.2% 1,932 4.7% 2,413 6.4% -19.9% NISSAN 659 3.5% 662 4.4% -0.5% 1,106 2.7% 1,457 3.9% -24.1% PEUGEOT 462 2.4% 205 1.4% 125.4% 1,244 3.0% 821 2.2% 51.5% VOLVO 429 2.3% 369 2.5% 16.3% 998 2.4% 837 2.2% 19.2% KIA 425 2.2% 634 4.2% -33.0% 933 2.3% 1,748 4.7% -46.6% HYUNDAI 375 2.0% 702 4.7% -46.6% 838 2.0% ...
Automotive Sales Data Updated at: 2026/05/07
Israel - New car sales in 2026 by OEM
Skoda 1,914 7.1% 2,489 10.2% -23.1% 5,481 8.0% 6,364 9.0% -13.9% BYD Auto 1,059 3.9% 630 2.6% 68.1% 3,464 5.1% 2,578 3.6% 34.4% SAIC/MG 856 3.2% 279 1.1% 206.8% 1,883 2.8% 2,185 3.1% -13.8% Xpeng 551 2.0% 691 2.8% -20.3% 1,057 1.5% 1,592 2.2% -33.6% Nissan 525 1.9% 519 2.1% 1.2% 890 1.3% 1,429 2.0% -37.7% Citroen 480 1.8% 550 2.3% -12.7% 1,275 1.9% 1,109 1.6% 15.0% Geely 465 1.7% 181 0.7% 156.9% 888 1.3% 493 0.7% 80.1% Mitsubishi 3...
Automotive Sales Data Updated at: 2026/05/07
Belgium - New car sales in 2026 by OEM
are Jan.-Feb. Share VW 3,732 10.1% 3,886 9.7% -4.0% 6,902 9.8% 7,518 9.3% -8.2% BMW 3,311 8.9% 4,311 10.7% -23.2% 6,444 9.2% 10,309 12.8% -37.5% Renault 2,748 7.4% 3,710 9.2% -25.9% 4,656 6.6% 5,933 7.3% -21.5% Mercedes-Benz 2,592 7.0% 2,484 6.2% 4.3% 5,671 8.1% 6,171 7.6% -8.1% Dacia 2,429 6.6% 2,228 5.5% 9.0% 3,747 5.3% 4,751 5.9% -21.1% Peugeot 2,396 6.5% 2,154 5.4% 11.2% 4,759 6.8% 4,007 5.0% 18.8% Audi 1,983 5.3% 2,441 6.1% -...
Automotive Sales Data Updated at: 2026/05/07
Norway - New car sales in 2026 by OEM
6 1.9% 583 1.8% -11.5% Ford 250 1.4% 410 3.1% -39.0% 568 2.1% 949 3.0% -40.1% Kia 228 1.3% 282 2.1% -19.1% 300 1.1% 893 2.8% -66.4% Mercedes-Benz 225 1.3% 618 4.6% -63.6% 409 1.5% 1,454 4.6% -71.9% MG 210 1.2% 422 3.2% -50.2% 543 2.0% 721 2.3% -24.7% Mazda 173 1.0% 121 0.9% 43.0% 267 1.0% 429 1.4% -37.8% Changan 160 0.9% - -% -% 392 1.4% - -% -% Lexus 152 0.9% 143 1.1% 6.3% 273 1.0% 389 1.2% -29.8% Opel 147 0.8% 148 1.1% -0.7% 278...
Automotive Sales Data Updated at: 2026/05/07
South Africa - New car sales in 2026 by OEM, vehicle type
ai 3,023 6.3% Ford 2,665 5.5% Great Wall Motors 2,521 5.2% Chery 2,258 4.7% Kia 1,888 3.9% Mahindra 1,671 3.5% JETOUR 1,550 3.2% Renault 1,415 2.9% Omoda / Jaecoo 1,413 2.9% Isuzu 1,385 2.9% Nissan 1,133 2.4% BMW 1,094 2.3% Stellantis 530 1.1% MG 458 1.0% Mercedes-Benz * 429 0.9% Foton 428 0.9% Honda 311 0.6% JAC 270 0.6% Jaguar 254 0.5% Mazda 234 0.5% BAIC Motor 228 0.5% Mitsubishi 130 0.3% Porsche 82 ...
Automotive Sales Data Updated at: 2026/05/07
Monthly Sales by Major Automakers and Groups, 2025
.3% Hyundai-Kia 585.9 7.0% 4 Stellantis 398.2 5.9% Stellantis 407.9 6.3% Stellantis 527.0 6.2% Stellantis 453.6 6.2% Stellantis 459.0 6.1% Stellantis 463.2 6.1% Stellantis 449.0 6.1% GM 379.5 5.3% Stellantis 469.4 5.8% Stellantis 459.4 5.6% Stellantis 429.7 5.3% Stellantis 463.9 5.6% 5 Geely 319.8 4.8% GM 313.4 4.8% GM 412.4 4.9% GM 390.5 5.3% GM 388.0 5.2% BYD 356.3 ...
Automotive Sales Data Updated at: 2026/03/10
Russia - New car sales in 2025 by OEM, vehicle type
7 units, Geely sales were down 5.1% to 10,141 units, TENET sales 9,919 units, BelGee (JV of Belarus state and Geely) sales were up 162.8% to 8,322 units. New vehicle sales by type Type Nov. 2025 Nov. 2024 Y-o-Y Jan.-Nov. 2025 Jan.-Nov. 2024 Y-o-Y Passenger Cars 126,127 119,335 5.7% 1,172,048 1,429,333 -18.0% Light commercial vehicles 6,847 11,387 -39.9% 74,172 97,328 -23.8% Pickups 1,986 2,591 -23.4% 19,545 26,556 -26.4% Trucks 5,071 9...
Automotive Sales Data Updated at: 2026/03/03
Portugal - New car sales in 2025 by OEM
6% 66 0.4% 45.5% 1,219 0.7% 831 0.5% 46.7% Polestar 75 0.4% 24 0.2% 212.5% 420 0.2% 181 0.1% 132.0% Honda 73 0.4% 53 0.4% 37.7% 535 0.3% 588 0.4% -9.0% Lexus 73 0.4% 63 0.4% 15.9% 512 0.3% 467 0.3% 9.6% Alfa Romeo 55 0.3% 27 0.2% 103.7% 548 0.3% 397 0.3% 38.0% Smart 46 0.3% 57 0.4% -19.3% 429 0.3% 441 0.3% -2.7% Mazda 45 0.3% 53 0.4% -15.1% 444 0.3% 518 0.3% -14.3% Land Rover 34 0.2% 64 0.4% -46.9% 813 0.5% 731 0.5% 11.2% DS 34 0....
Automotive Sales Data Updated at: 2026/03/02
Philippines - New car sales in 2025 by vehicle type
9,775 units. Of this, passenger car sales dropped by 28.0% to 7,895 units, while commercial vehicle sales rose by 8.8% to 31,880 units.Electrified vehicle sales in May totaled 3,613 units, comprising 801 BEVs, 20 PHEVs, and 2,792 HEVs.From January to May, total vehicle sales rose by 1.7% YoY to 190,429 units. Passenger car sales declined by 21.4% to 38,725 units, while commercial vehicle sales increased by 10.0% to 151,704 units. Electrified vehi...
Automotive Sales Data Updated at: 2026/02/26
Thailand - New car sales in 2025 by OEM, model, vehicle type
,184 3.6% 48.3% 16,232 4.2% 9,184 2.6% 76.7% Changan 3,323 6.9% 802 2.4% 314.3% 11,265 2.9% 6,887 2.0% 63.6% GWM 1,595 3.3% 387 1.2% 312.1% 10,176 2.7% 3,655 1.0% 178.4% GAC 517 1.1% 342 1.0% 51.2% 9,385 2.5% 4,096 1.2% 129.1% MG 1,919 4.0% 498 1.5% 285.3% 8,913 2.3% 4,500 1.3% 98.1% Hino 429 0.9% 420 1.3% 2.1% 4,317 1.1% 4,550 1.3% -5.1% Nissan 532 1.1% 562 1.7% -5.3% 3,894 1.0% 5,821 1.7% -33.1% Mazda 403 0.8% 379 1.1% 6.3% 3,345 ...
Automotive Sales Data Updated at: 2026/02/24
New Zealand - New car sales in 2025 by OEM, vehicle type
3.0% 964 2.7% Nissan 184 2.7% 1,133 3.1% BMW 145 2.1% 786 2.2% Lexus 129 1.9% 640 1.8% VW 120 1.8% 759 2.1% Mercedes-Benz 120 1.8% 623 1.7% Jaecoo 102 1.5% 369 1.0% Audi 100 1.5% 466 1.3% Land Rover 88 1.3% 494 1.4% MINI 86 1.3% 412 1.1% Polestar 86 1.3% 365 1.0% Skoda 84 1.2% 429 1.2% Omoda 61 0.9% 345 0.9% Tesla 56 0.8% 357 1.0% BYD 51 0.7% 552 1.5% Porsche 51 0.7% 261 0.7% Peugeot 43 0.6% 277 0.8% Volvo 37 0.5...
Automotive Sales Data Updated at: 2026/02/13
Vietnam - New car sales in 2025 by OEM, vehicle type
548 10.3% -29.7% 27,785 8.5% 29,755 9.6% -6.6% Thaco Kia 2,861 7.3% 5,299 12.0% -46.0% 22,943 7.0% 32,518 10.5% -29.4% Thaco Truck 2,200 5.6% 1,940 4.4% 13.4% 21,983 6.7% 14,784 4.8% 48.7% Isuzu* 1,071 2.7% 1,354 3.1% -20.9% 10,429 3.2% 9,671 3.1% 7.8% Suzuki 660 1.7% 877 2.0% -24.7% 5,717 1.7% 9,601 3.1% -40.5% Hino* 396 1.0% 123 0.3% ...
Automotive Sales Data Updated at: 2026/02/12
China - New car sales in 2025 by OEM, model, vehicle type
s(10,000) Share(%) Y-o-Y(%) Sedan/Hatchback 112.4 34.4 -10.2 1,242.4 36.1 7.9 MPV 11.2 3.4 -17.0 121.3 3.5 15.5 SUV 159.0 48.6 -6.3 1,612.3 46.9 9.5 Mini Van 2.1 0.6 -41.7 34.3 1.0 25.3 Passenger Cars Total 284.7 87.0 -8.7 3,010.3 87.5 9.2 Commercial Vehicles Total 42.5 13.0 15.3 429.6 12.5 10.9 Grand Total 327.2 100.0 -6.2 3,440.0 100.0 9.4 Source:Created by MarkLines based on press release New vehicle sales by bran...
Automotive Sales Data Updated at: 2026/02/10


 Japan
Japan USA
USA Mexico
 Germany
 China (Shanghai)
 Thailand
 India
India