


Search Results by Category
All information related to {{ key_word }}.
AI Navigator will guide you. Click here for information about {{ key_word }}.
Images
 1
1
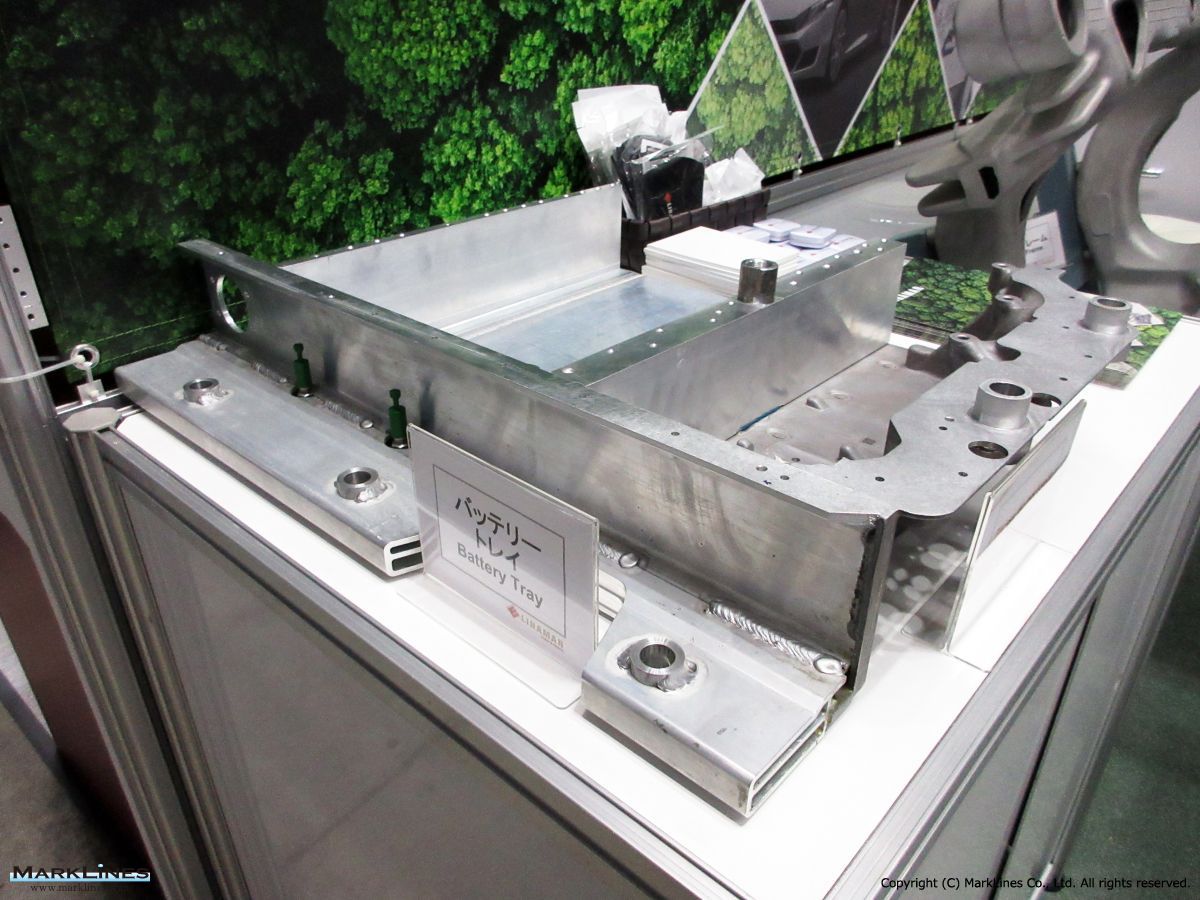
Battery tray
 1
1
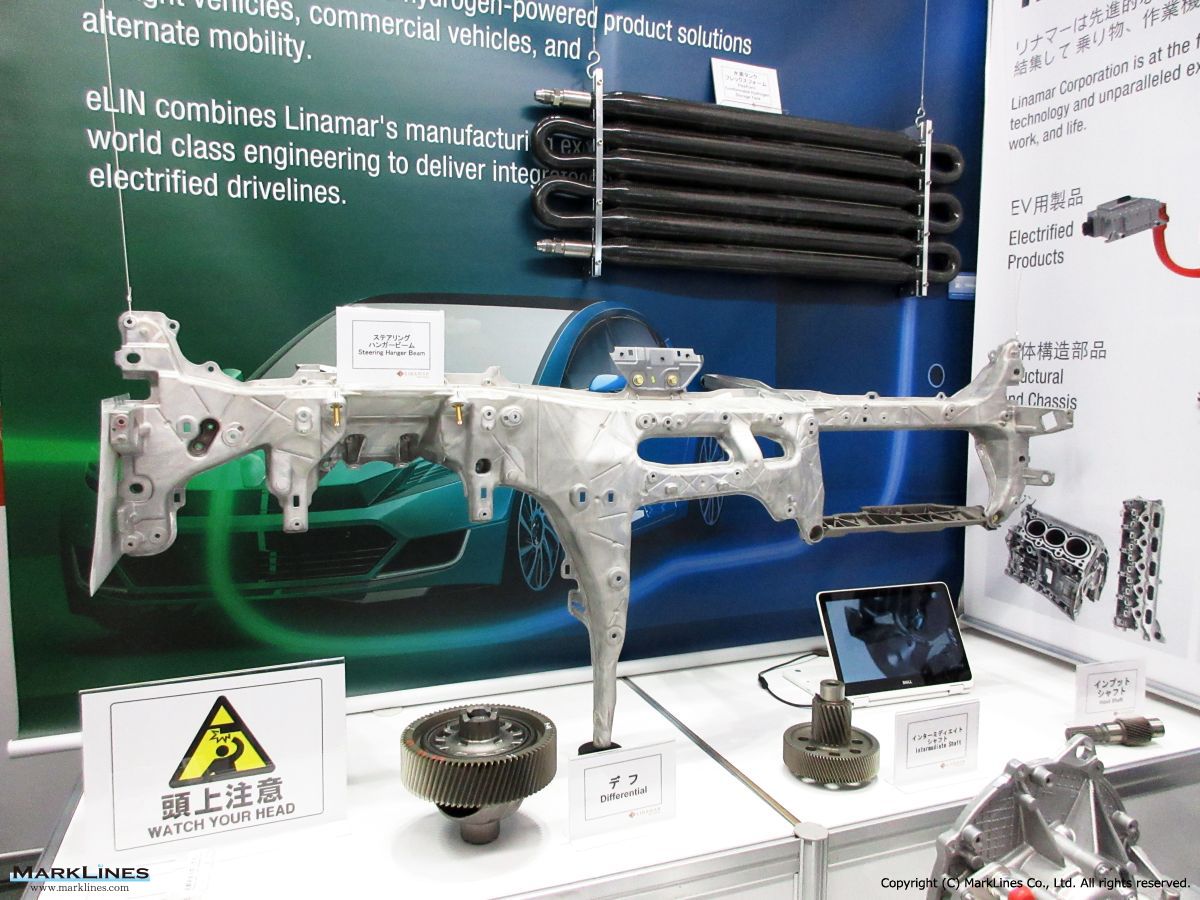
Steering hanger beam
 4
4
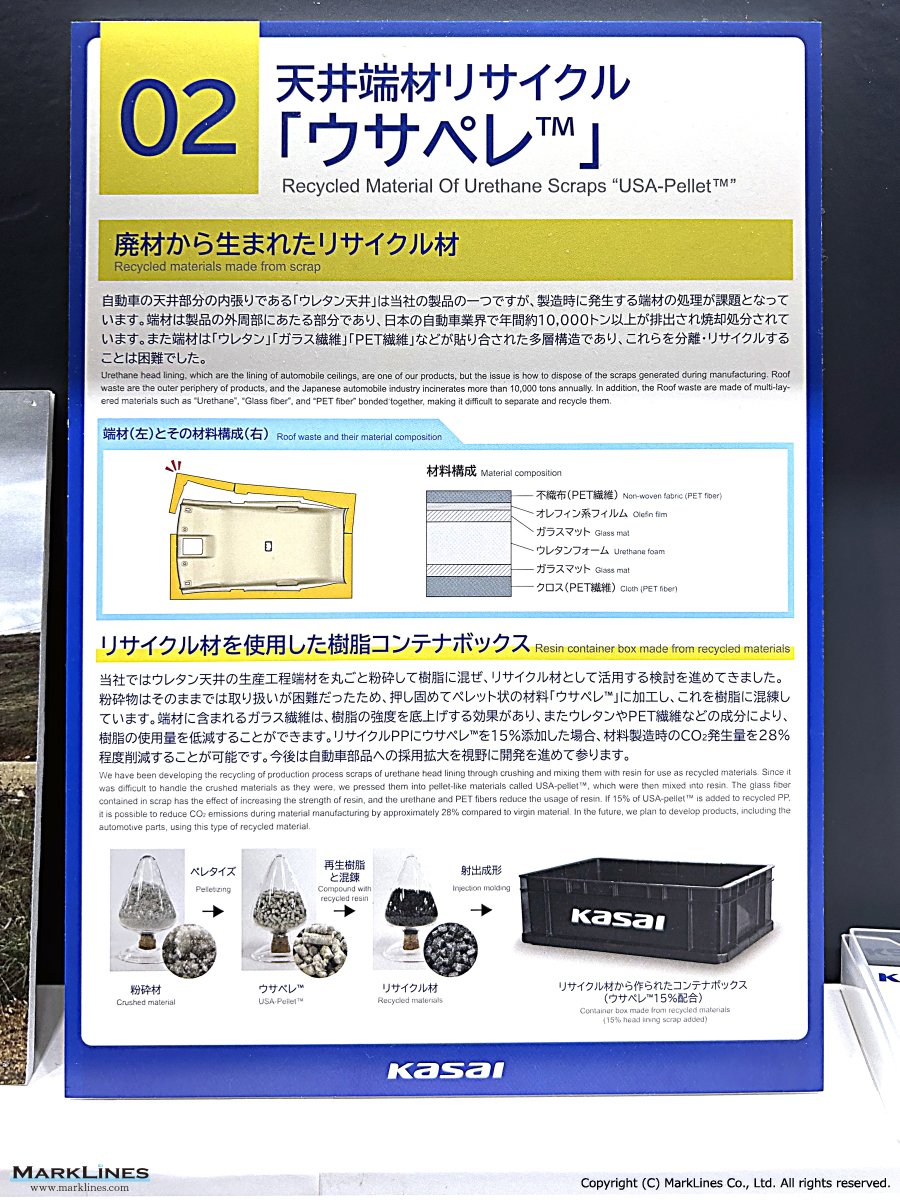
Recycled material of urethane scraps "USA-Pellet"
 3
3
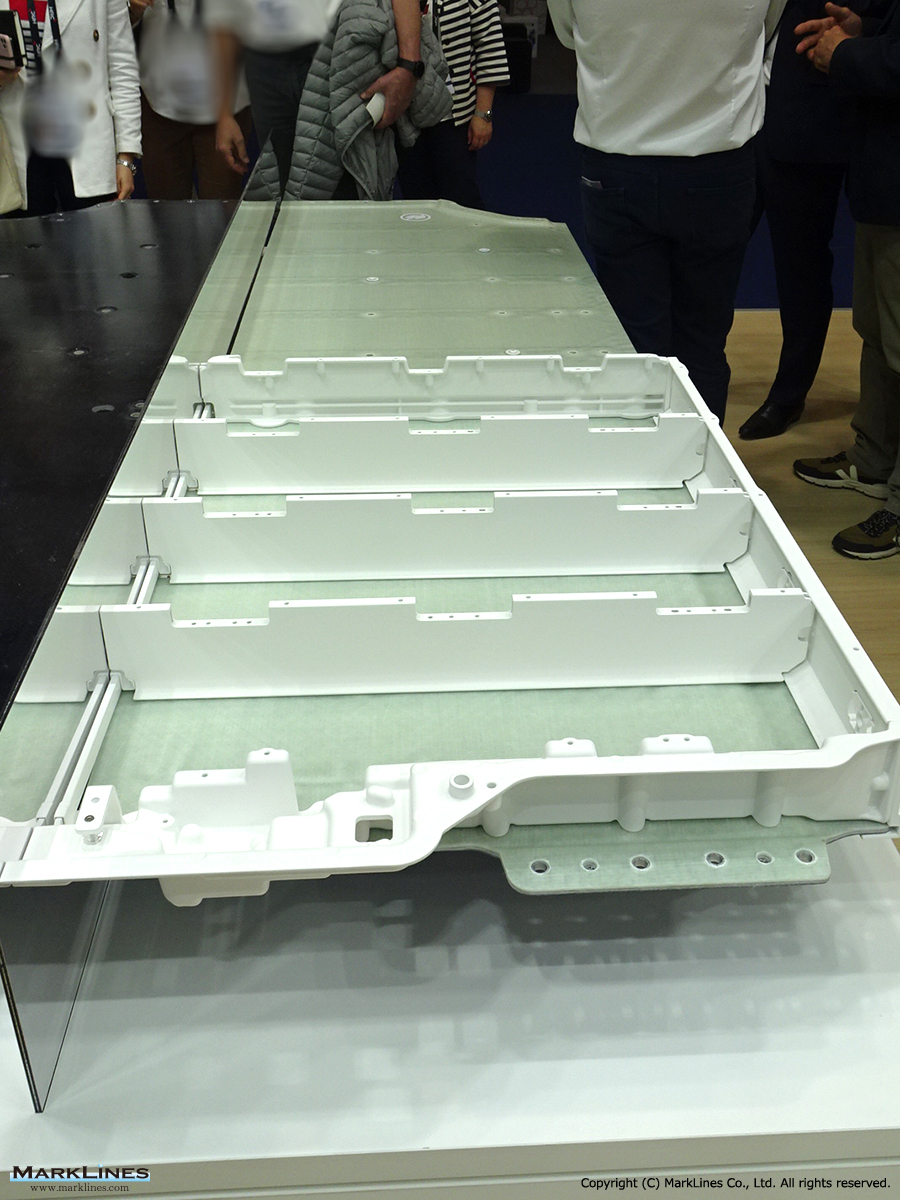
Battery base plate (front: light green and back: black)
 1
1
Exterior mirror
1
Exterior mirror
 1
1
Mercedes‑Benz completes logistics project at Tuscaloosa Plant in Alabama
 1
1
Audi brings Digital Matrix LED headlights to U.S. on new Q9 flagship SUV
 1
1
HERE unveils AI-based last meter guidance solution
 3
3
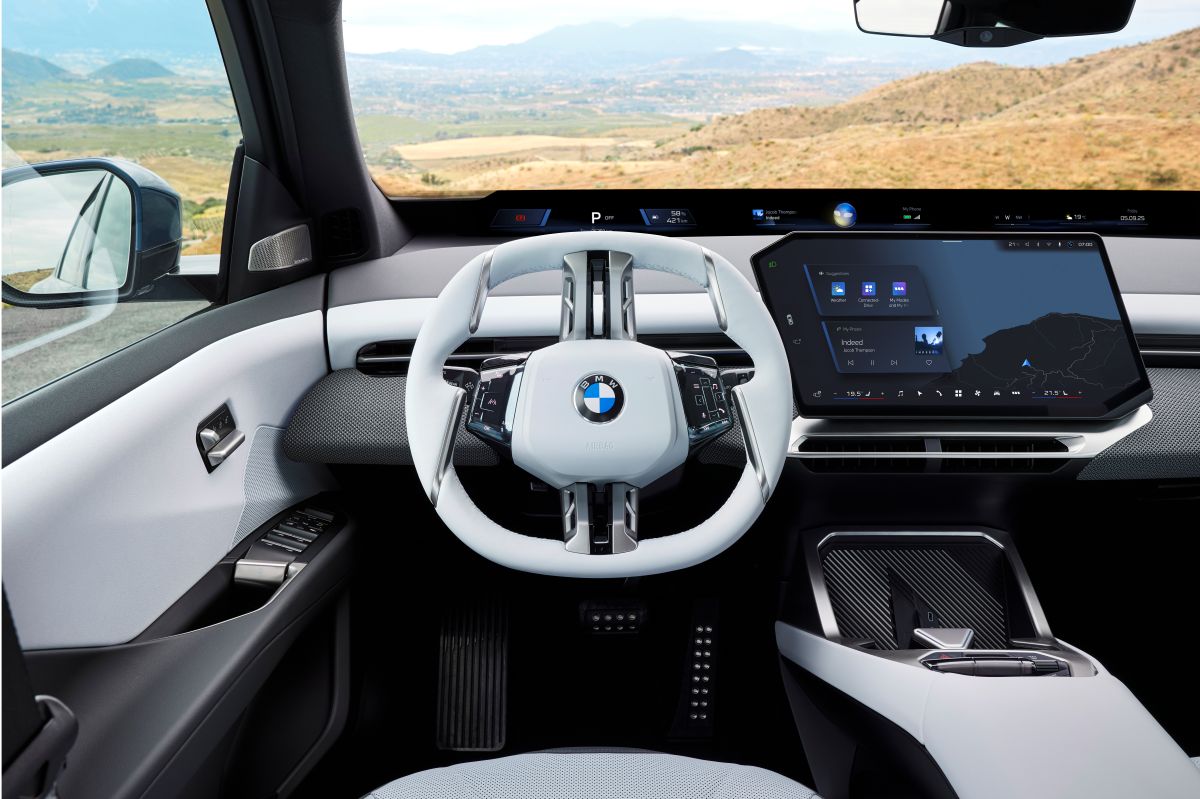
BMW prepares for U.S. launch of 2027 BMW iX3 50 xDrive U.S. in September
Sort by :
1 - 20 of 29 results
Data changes for Sales Statistics
e period January - March 2026 has been revised. May 19, 2026 Turkiye The number of trucks and buses in Turkiye has been available since 2021. As a result, the total sales figures for 2021 to 2025 have also been revised. May 12, 2026 Mexico Sales figures in 2025 have been updated. May 11, 2026 USA Sales figures of BMW in 2025 have been updated. April 21, 2026 New Zealand Starting from January 2026, sales figures will be changed from OEM-ba...
Automotive Sales Data Updated at: 2026/05/27
USA - New car sales in 2026 by OEM, model, vehicle type
USA - New car sales in 2026 by OEM, model, vehicle type Flash report, Automotive sales volume, 2026 Jan. Feb. Mar. Apr. May Jun. Jul. Aug. Sep. Oct. Nov. Dec. Flash report, April 2026 May 2, 2026 U.S. auto sales down 6.0% in April, rising gasoline prices above USD 4 boost demand for sedans and electrified vehiclesNote: Some figures were updated on May 8.According to preliminary figures compiled by MarkLines as of May 2, U.S. new‐vehicle sales ...
Automotive Sales Data Updated at: 2026/05/25
USA - New car sales in 2025 by OEM, model, vehicle type
USA - New car sales in 2025 by OEM, model, vehicle type Flash report, Automotive sales volume, 2025 Jan. Feb. Mar. Apr. May Jun. Jul. Aug. Sep. Oct. Nov. Dec. Flash report, December 2025 Jan 6, 2026 U.S. auto sales down 1.5% in December, up 2.7% for 2025 full year to 16.39 million unitsNote: Some figures were updated on January 21.MarkLines' data compiled as of January 6, 2026, shows that U.S. new car sales for December 2025 were 1,476,588 units...
Automotive Sales Data Updated at: 2026/02/04
Volume data search results
Category Data Our EV/HV/PHV/FCV sales figures are basically based on "A models" due to the limitations of data source.EV/HV/PHV/FCV sales figures of "B models" are only available for limited countries. Consequently, figures of All EV/HV/PHV/FCV models (A+B) are only available for several countries (USA, Sweden etc.) Please refer to the chart below for the data availability for each country. A models EV/HV/PHV/FCV models that does NOT share a m...
Automotive Sales Data Updated at: 2025/12/09
USA - New car sales in 2024 by OEM, model, vehicle type
USA - New car sales in 2024 by OEM, model, vehicle type Flash report, Automotive sales volume, 2024 Jan. Feb. Mar. Apr. May Jun. Jul. Aug. Sep. Oct. Nov. Dec. Flash report, December 2024 Jan 6, 2025 U.S. auto sales up 2.0% in December, up 2.3% for full year to 15.98 million unitsNote: Some figures were updated on January 15.The number of new vehicles sold in the U.S. in December 2024 (preliminary figures including estimates for GM/Stellantis/Tes...
Automotive Sales Data Updated at: 2025/07/03
USA - Flash report, Automotive sales volume, 2023
USA - Flash report, Automotive sales volume, 2023 Flash report, Automotive sales volume, 2023 Jan. Feb. Mar. Apr. May Jun. Jul. Aug. Sep. Oct. Nov. Dec. Flash report, December 2023 Jan 4, 2024 U.S. car sales up 13.0% in December, up 12.3% for full-year 2023Note: Some figures were updated on Jan. 11.U.S. light vehicle sales in December of 1,454,597 units were up 13.0% as compared to the same month in 2022.Truck and SUV sales increased 15.7% from ...
Automotive Sales Data Updated at: 2025/06/04
USA - Flash report, Automotive sales volume, 2022
USA - Flash report, Automotive sales volume, 2022 Flash report, Automotive sales volume, 2022 Jan. Feb. Mar. Apr. May Jun. Jul. Aug. Sep. Oct. Nov. Dec. Flash report, Dec 2022 Jan 5, 2023 U.S. car sales up 5.4% in December, down 7.8% for full-year 2022※Sales figures of Mercedes Benz and Porche have been updated. January 11, 2023U.S. light vehicle sales in December of 1,287,280 units were up 5.4% as compared to the same month in 2021.Truck and ...
Automotive Sales Data Updated at: 2025/06/04
USA - Flash report, Automotive sales volume, 2021
USA - Flash report, Automotive sales volume, 2021 Flash report, Automotive sales volume, 2021 Jan. Feb. Mar. Apr. May Jun. Jul. Aug. Sep. Oct. Nov. Dec. Flash report, December 2021 Jan 5, 2022 U.S. car sales down 24.6% in December, up 3.4% for full-year 2021U.S. light vehicle sales in December of 1,221,647 units were down 24.6% as compared to the same month in 2020.Truck and SUV sales fell 23.7% from last December to 965,943 units, while passeng...
Automotive Sales Data Updated at: 2025/06/04
USA - Flash report, Sales volume, 2020
USA - Flash report, Sales volume, 2020 Flash report, Sales volume, 2020 Jan. Feb. Mar. Apr. May Jun. Jul. Aug. Sep. Oct. Nov. Dec. Flash report, December 2020 6 Jan. 2021 U.S. car sales up 5.1% in December, down 14.6% for full-year 2020 (Sales figures of Volvo have been updated. January 7, 2021)U.S. light vehicle sales in December of 1,619,085 units were up 5.1% as compared to the same month in 2019.Truck and SUV sales rose 10.7% from la...
Automotive Sales Data Updated at: 2025/06/04
Update History for Sales Statistics (2022)
motive Sales Statistics (2022) Short Term (Monthly) North/South America / Asia/Oceania / Western Europe / Central/ Eastern Europe / Middle East/Africa Latest Update History/Update history in the past North/South America Country 2022 Jan. Feb. Mar. Apr. May Jun. Jul. Aug. Sep. Oct. Nov. Dec. USA Feb. 2 Mar. 2 Apr. 4 May 6 Jun. 2 Jul. 4 Aug. 3 Sep. 2 Oct. 4 Nov. 2 Dec. 2 Jan. 5 USA (EV) Feb. 4 Mar. 3 Apr. 6 May 6 Jun. 6 Jul. 6 Aug. 5 Sep....
Automotive Sales Data Updated at: 2023/04/04
Update History for Automotive Sales Statistics (2021)
tive Sales Statistics (2021) Short Term (Monthly) North/South America / Asia/Oceania / Western Europe / Central/ Eastern Europe / Middle East/Africa Latest Update History/Update history in the past North/South America Country 2021 Jan. Feb. Mar. Apr. May Jun. Jul. Aug. Sep. Oct. Nov. Dec. USA Feb. 3 Mar. 3 Apr. 2 May 5 Jun. 3 Jul. 2 Aug. 4 Sep. 2 Oct. 4 Nov. 3 Dec. 2 Jan. 5 USA (HV) Feb. 4 Mar. 4 Apr. 3 May 6 Jun. 4 Jul. 3 Aug. 5 Sep....
Automotive Sales Data Updated at: 2022/03/28
Update History for Sales Statistics (2020)
ry for Sales Statistics (2020) Short Term (Monthly) North/South America / Asia/Oceania / Western Europe / Central/ Eastern Europe / Middle East/Africa Latest Update History/Update history in the past North/South America Country 2020 Jan. Feb. Mar. Apr. May Jun. Jul. Aug. Sep. Oct. Nov. Dec. USA Feb. 5 Mar. 5 Apr. 2 May 5 Jun. 3 Jul. 3 Aug. 4 Sep. 2 Oct. 2 Nov. 4 Dec. 2 Jan. 6 USA (Medium & Heavy Trucks) Feb. 13 Mar. 12 Apr. 15 May 14 Ju...
Automotive Sales Data Updated at: 2021/03/31
Update History for Sales Statistics (2019)
ry for Sales Statistics (2019) Short Term (Monthly) North/South America / Asia/Oceania / Western Europe / Central/ Eastern Europe / Middle East/Africa Latest Update History/Update history in the past North/South America Country 2019 Jan. Feb. Mar. Apr. May Jun. Jul. Aug. Sep. Oct. Nov. Dec. USA Feb. 4 Mar. 5 Apr. 3 May 3 Jun. 4 Jul. 4 Aug. 2 Sep. 5 Oct. 3 Nov. 4 Dec. 4 Jan. 7 USA (Medium & Heavy Trucks) Feb. 14 Mar. 15 Apr. 11 May 22 Ju...
Automotive Sales Data Updated at: 2020/04/01
Update History for Sales Statistics (2018)
ry for Sales Statistics (2018) Short Term (Monthly) North/South America / Asia/Oceania / Western Europe / Central/ Eastern Europe / Middle East/Africa Latest Update History/Update history in the past North/South America Country 2018 Jan. Feb. Mar. Apr. May Jun. Jul. Aug. Sep. Oct. Nov. Dec. USA Feb. 2 Mar. 2 Apr. 4 May 2 Jun. 4 Jul. 4 Aug. 2 Sep. 5 Oct. 3 Nov. 2 Dec. 4 Jan. 4 USA (Medium & Heavy Trucks) Feb. 21 Mar. 22 Apr. 23 May 16 Ju...
Automotive Sales Data Updated at: 2020/03/26
Update History for Sales Statistics (2017)
ry for Sales Statistics (2017) Short Term (Monthly) North/South America / Asia/Oceania / Western Europe / Central/ Eastern Europe / Middle East/Africa Latest Update History/Update history in the past North/South America Country 2017 Jan. Feb. Mar. Apr. May Jun. Jul. Aug. Sep. Oct. Nov. Dec. USA Feb. 2 Mar. 2 Apr. 4 May 8 Jun. 2 Jul. 4 Aug. 2 Sep. 4 Oct. 4 Nov. 2 Dec. 4 Jan. 4 USA (Medium & Heavy Trucks) Mar. 2 Mar. 30 Apr. 24 May 22 Jun...
Automotive Sales Data Updated at: 2020/03/26
USA - Flash report, Sales volume, 2019
USA - Flash report, Sales volume, 2019 Flash report, Sales volume, 2019 Jan. Feb. Mar. Apr. May Jun. Jul. Aug. Sep. Oct. Nov. Dec. Flash report, December 2019 4 Jan. 2020 U.S. car sales down 5.8% in December, down 1.3% for full-year 2019U.S. light vehicle sales in December of 1,533,555 units were down 5.8% as compared to the same month in 2018.Truck and SUV sales fell 3.2% from last December to 1,139,377 units, while passenger car sales declined...
Automotive Sales Data Updated at: 2020/01/21
USA - Flash report, Sales volume, 2018
USA - Flash report, Sales volume, 2018 Flash report, Sales volume, 2018 Jan. Feb. Mar. Apr. May Jun. Jul. Aug. Sep. Oct. Nov. Dec. Flash report, December 2018 4 Jan. 2019 U.S. car sales up 1.5% in December, up 0.3% for 2018U.S. light vehicle sales of 1,627,481 units in December were up 1.5% as compared to the same month in 2017.Truck and SUV sales rose 7.2% from last December to 1,165,092 units, while passenger car sales declined 10.5% to 462,38...
Automotive Sales Data Updated at: 2019/01/28
USA - Flash report, Sales volume, 2017
USA - Flash report, Sales volume, 2017 Flash report, Sales volume, 2017 Jan. Feb. Mar. Apr. May Jun. Jul. Aug. Sep. Oct. Nov. Dec. Flash report, December 2017 4 Jan. 2018 *There are cases where recently released data and detailed information in the database do not match up for reasons including different information sources, and discrepancies between preliminary reports and confirmed data. U.S. car sales fall 5.2% in December, down 1.8% for 2017...
Automotive Sales Data Updated at: 2018/07/24
Update History for Sales Statistics (2016)
ry for Sales Statistics (2016) Short Term (Monthly) North/South America / Asia/Oceania / Western Europe / Central/ Eastern Europe / Middle East/Africa Latest Update History/Update history in the past North/South America Country 2016 Jan. Feb. Mar. Apr. May Jun. Jul. Aug. Sep. Oct. Nov. Dec. USA 2/3 3/2 4/4 5/6 6/2 7/4 8/3 9/2 10/4 11/2 12/2 1/5 USA (Medium & Heavy Trucks) 2/25 3/23 4/26 5/30 6/29 7/28 8/23 9/28 10/31 11/29 1/6 1/25 Ca...
Automotive Sales Data Updated at: 2017/03/02
USA - Flash report, Sales volume, 2016
USA - Flash report, Sales volume, 2016 Flash report, Sales volume, 2016 Jan. Feb. Mar. Apr. May Jun. Jul. Aug. Sep. Oct. Nov. Dec. Flash report, December 2016 5 Jan. 2017 *There are cases where recently released data and detailed information in the database do not match up for reasons including different information sources, and discrepancies between preliminary reports and confirmed data. U.S. car sales up 3.1% in December, up 0.4% for 2016U.S....
Automotive Sales Data Updated at: 2017/01/05


 Japan
Japan USA
USA Mexico
 Germany
 China (Shanghai)
 Thailand
 India
India