


Search Results by Category
All information related to {{ key_word }}.
AI Navigator will guide you. Click here for information about {{ key_word }}.
Images
 3
3
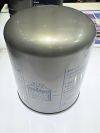
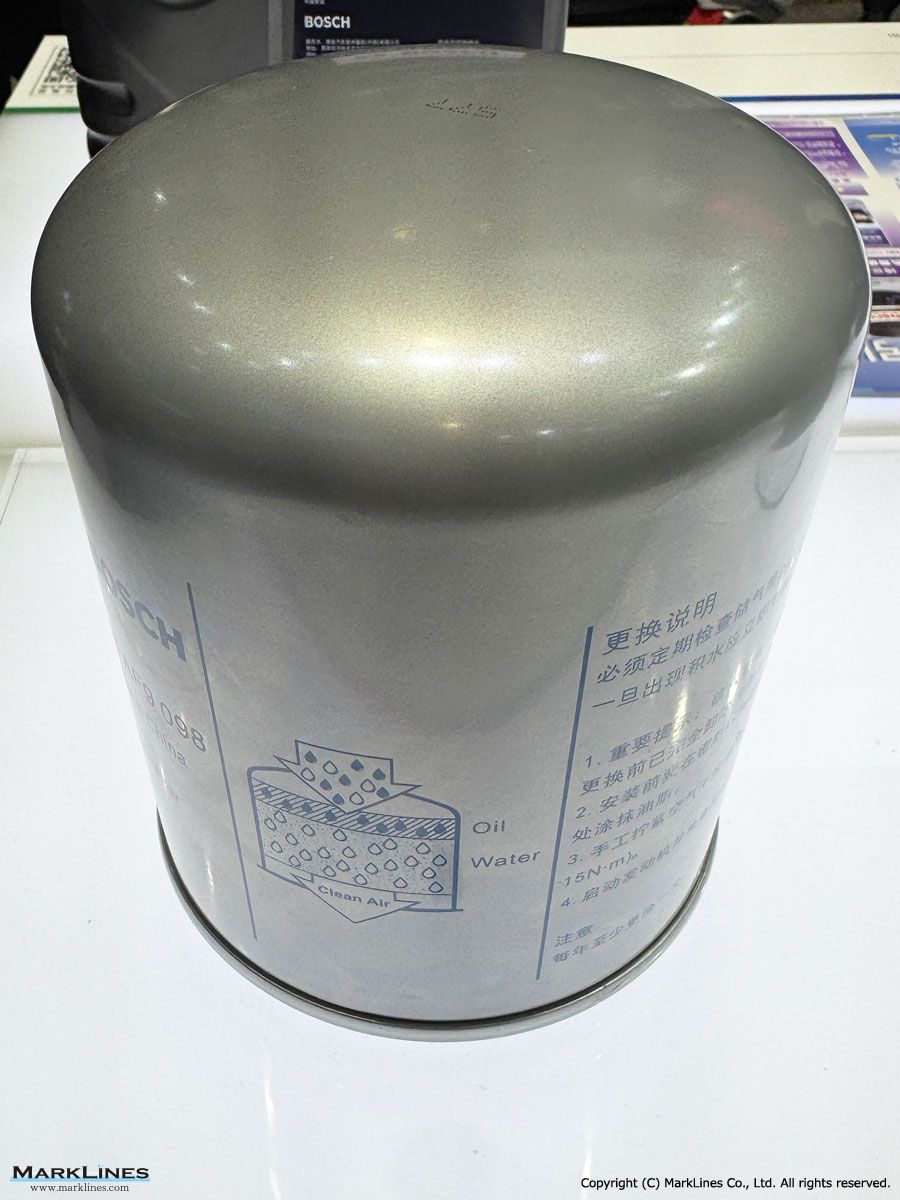
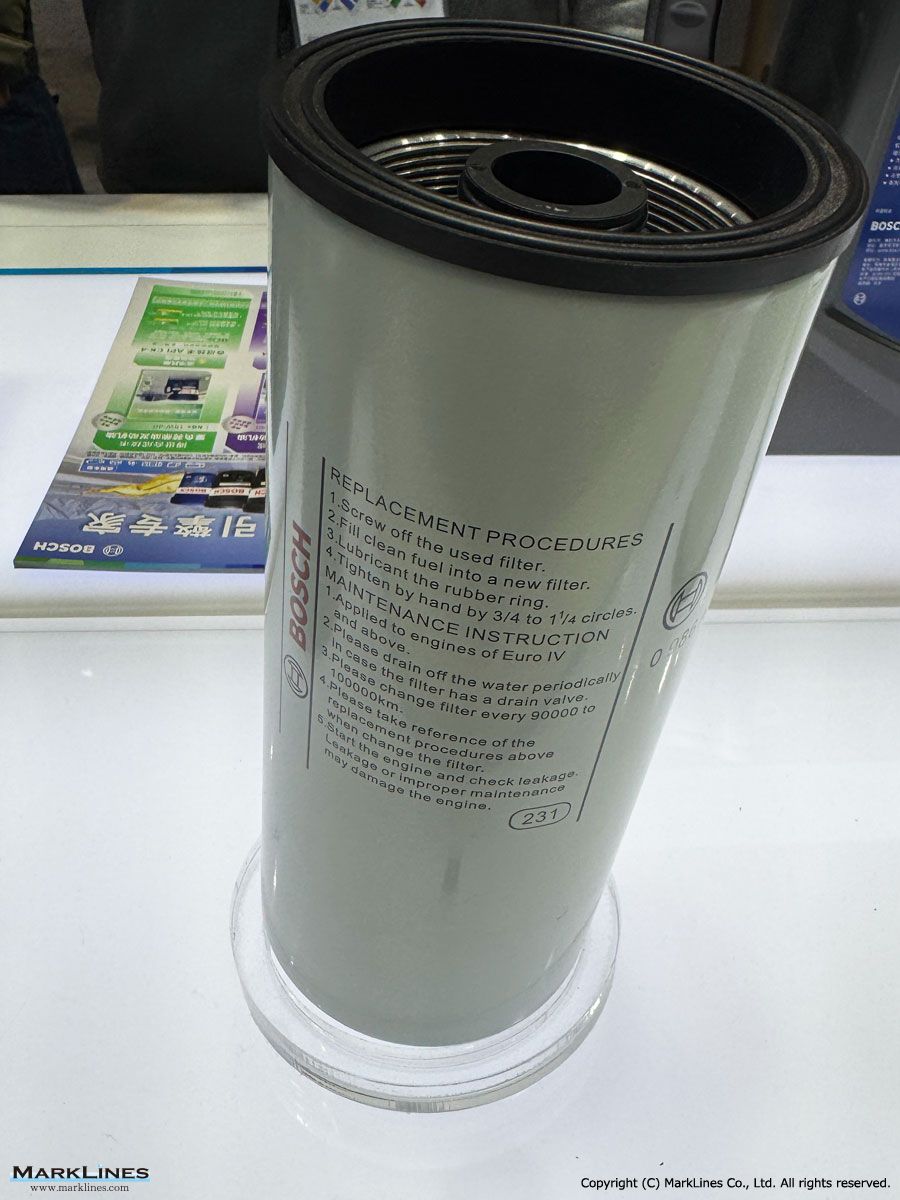
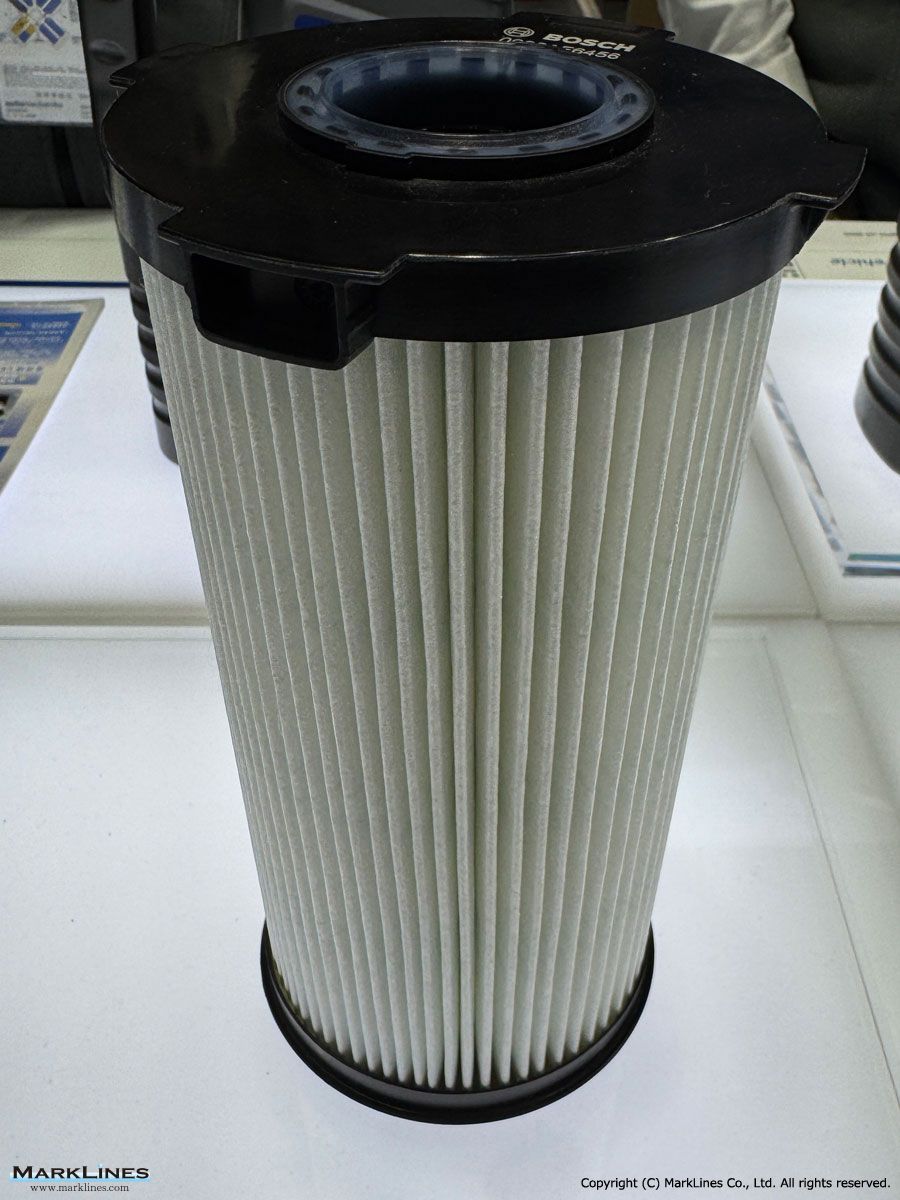
Bosch filters for commercial vehicles
 3
3
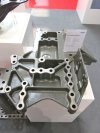
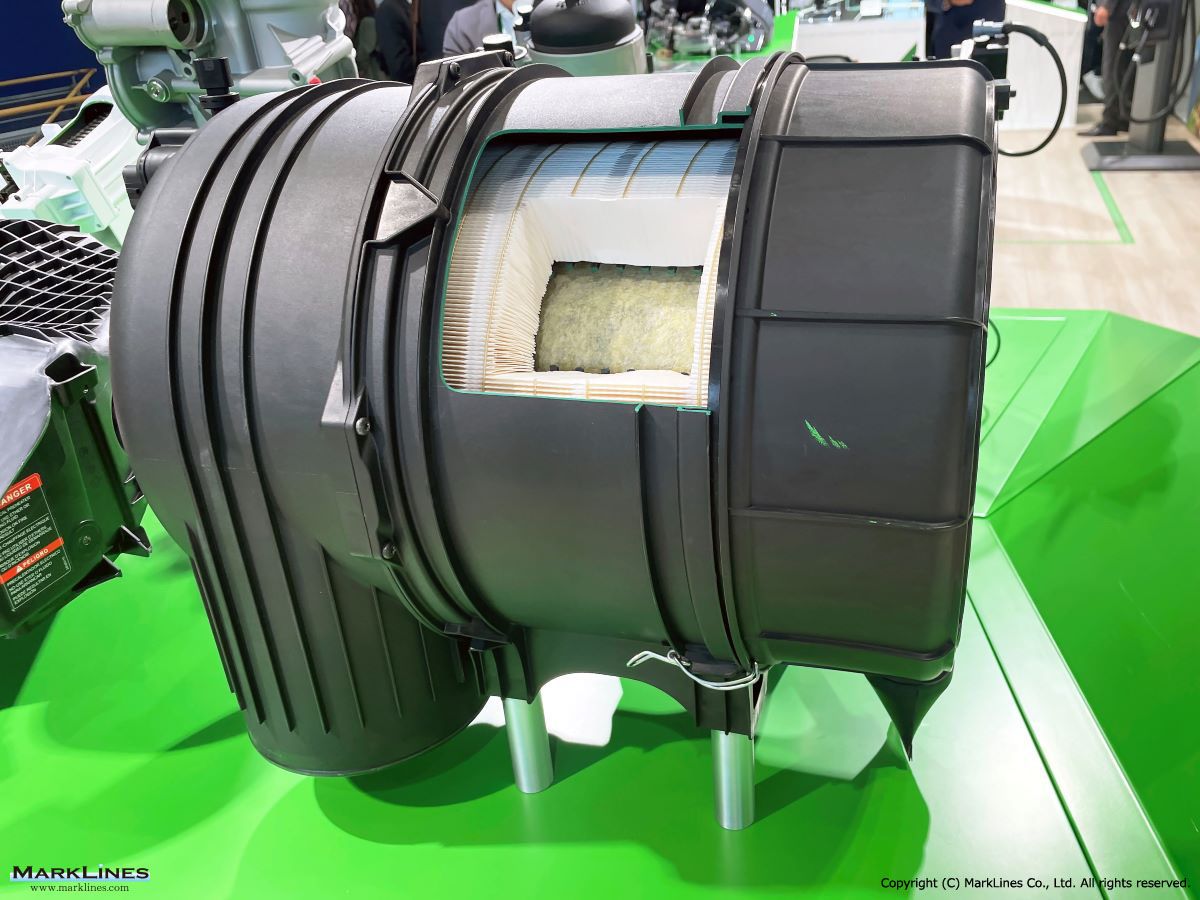
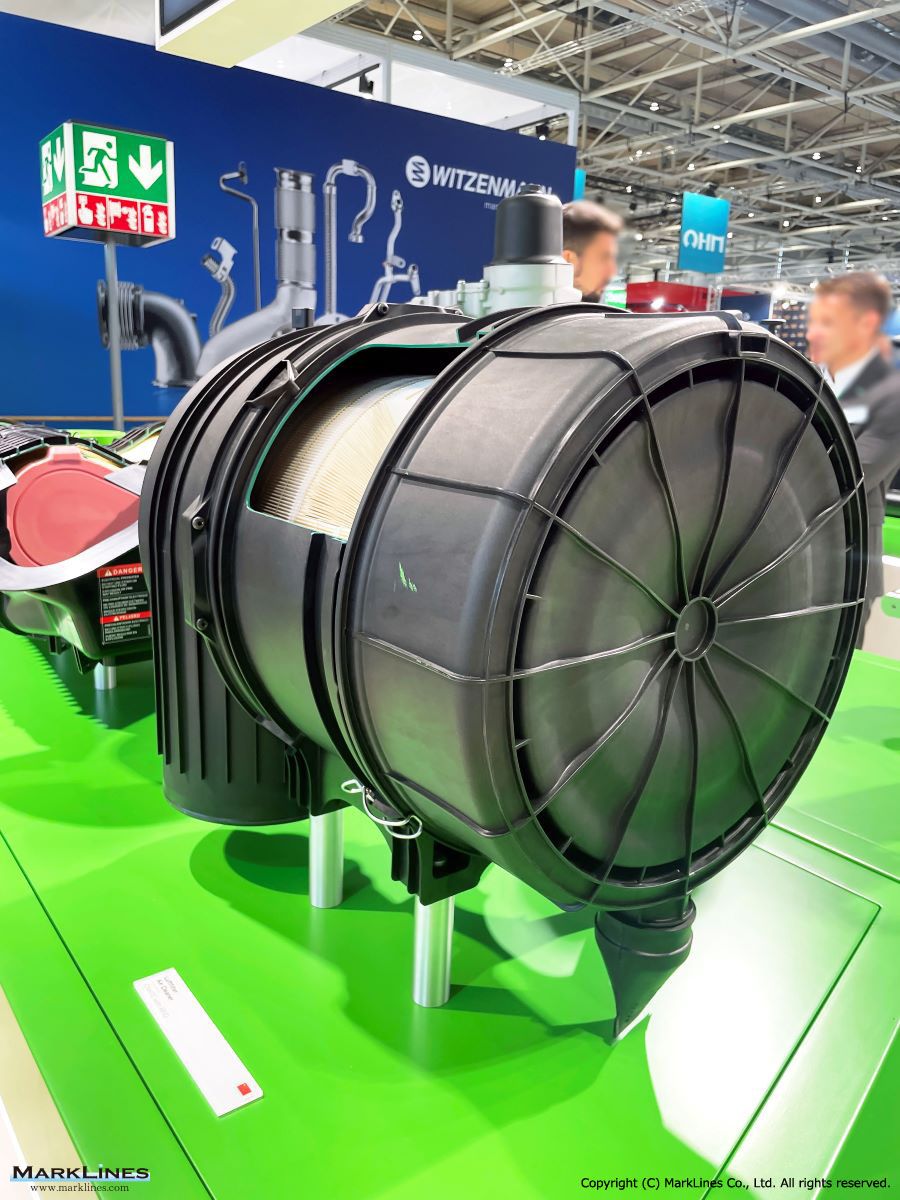
Air Cleaner
 1
1
Auxiliary Gearbox Hub Sleeve
 3
3
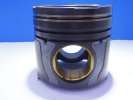
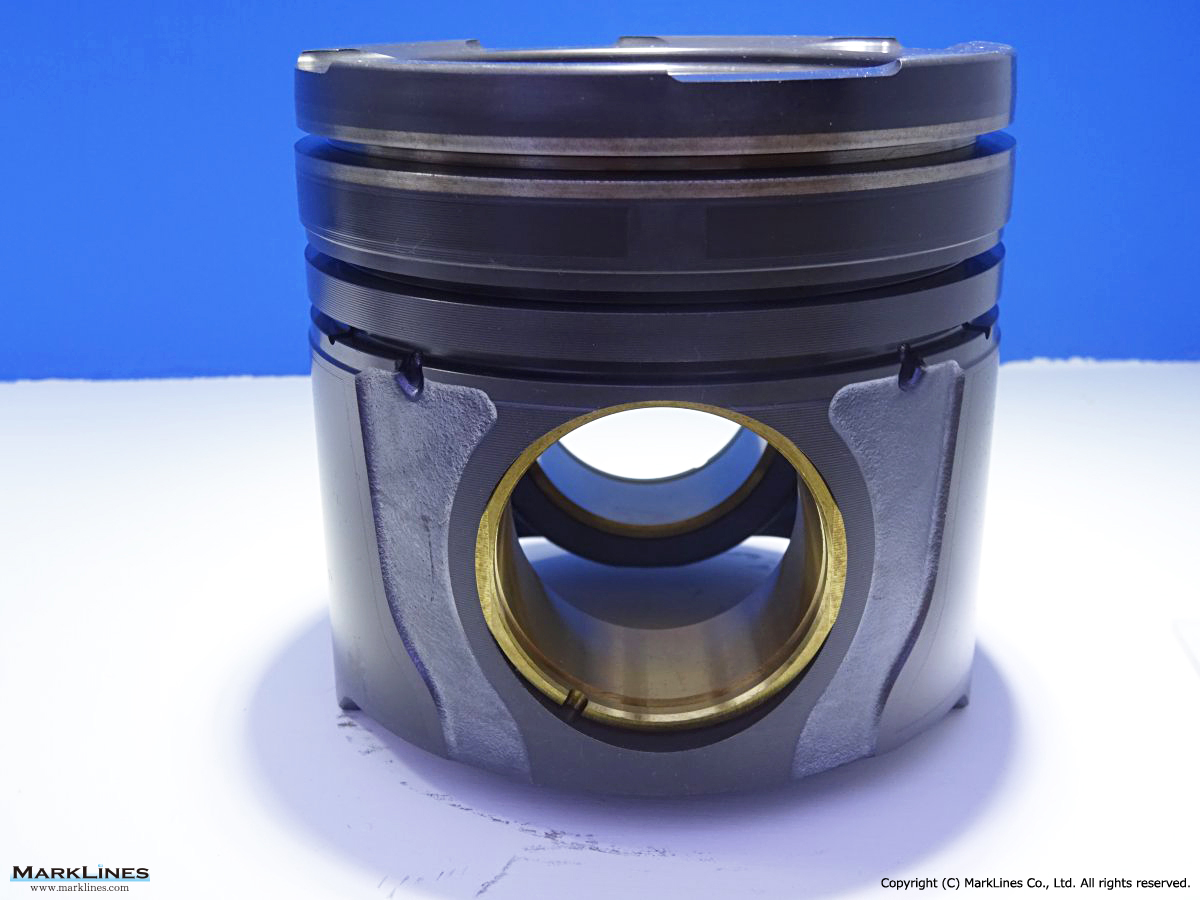
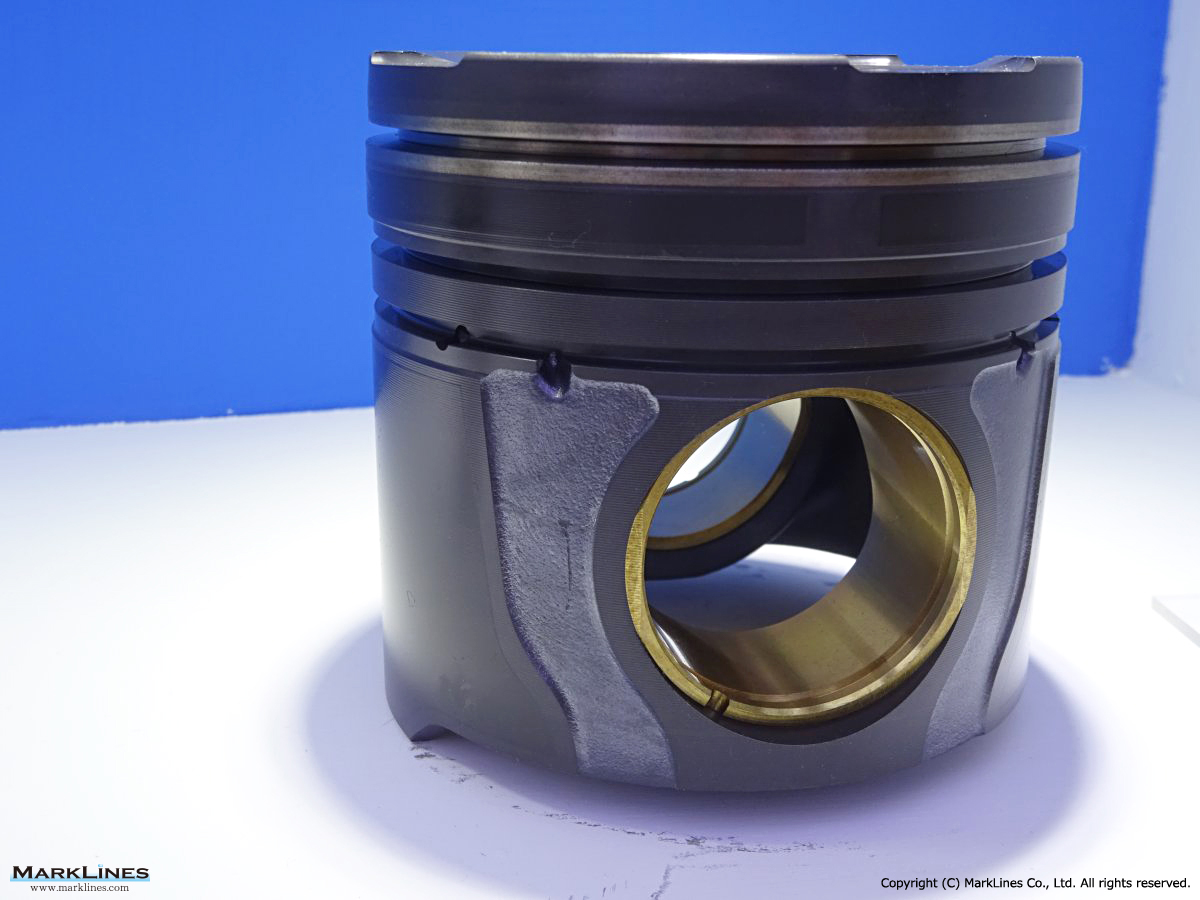
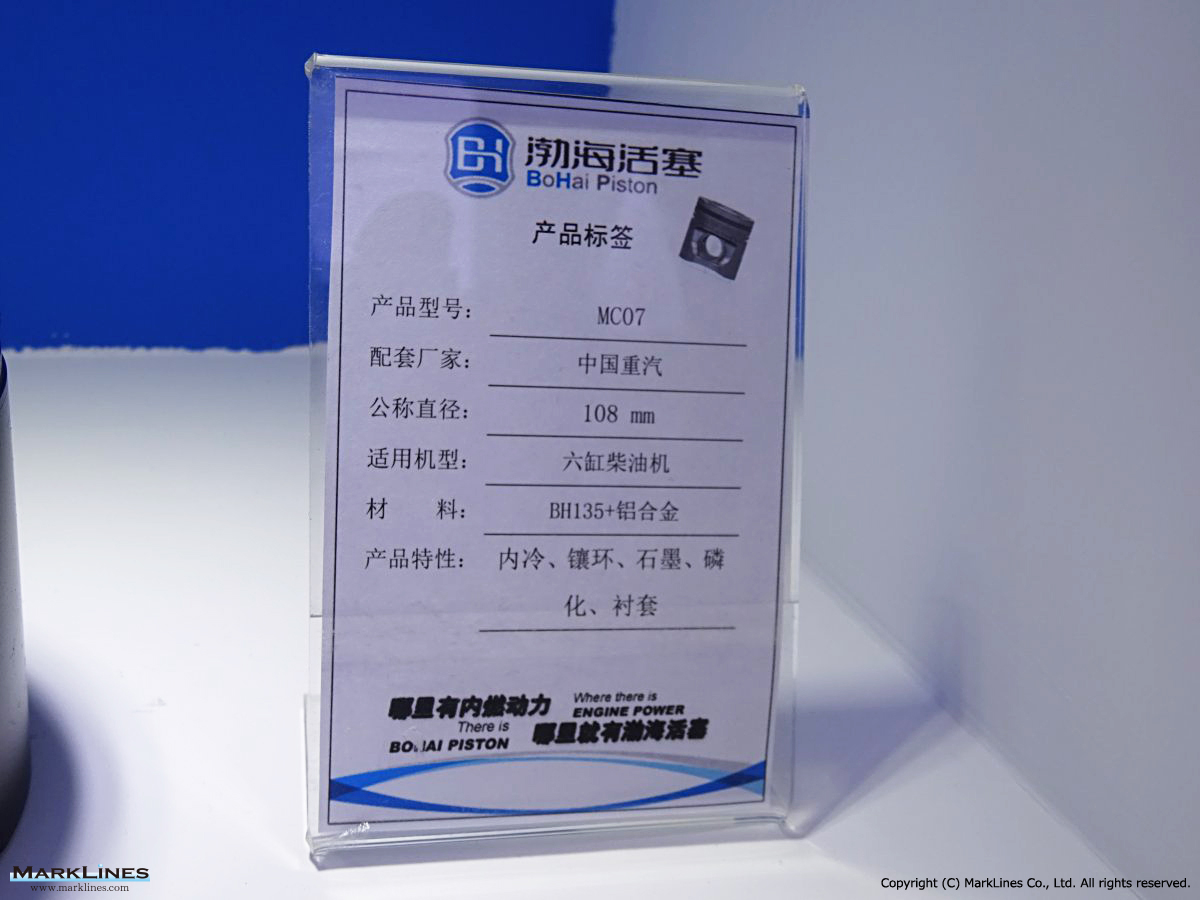
Diesel Engine Piston
 2
2
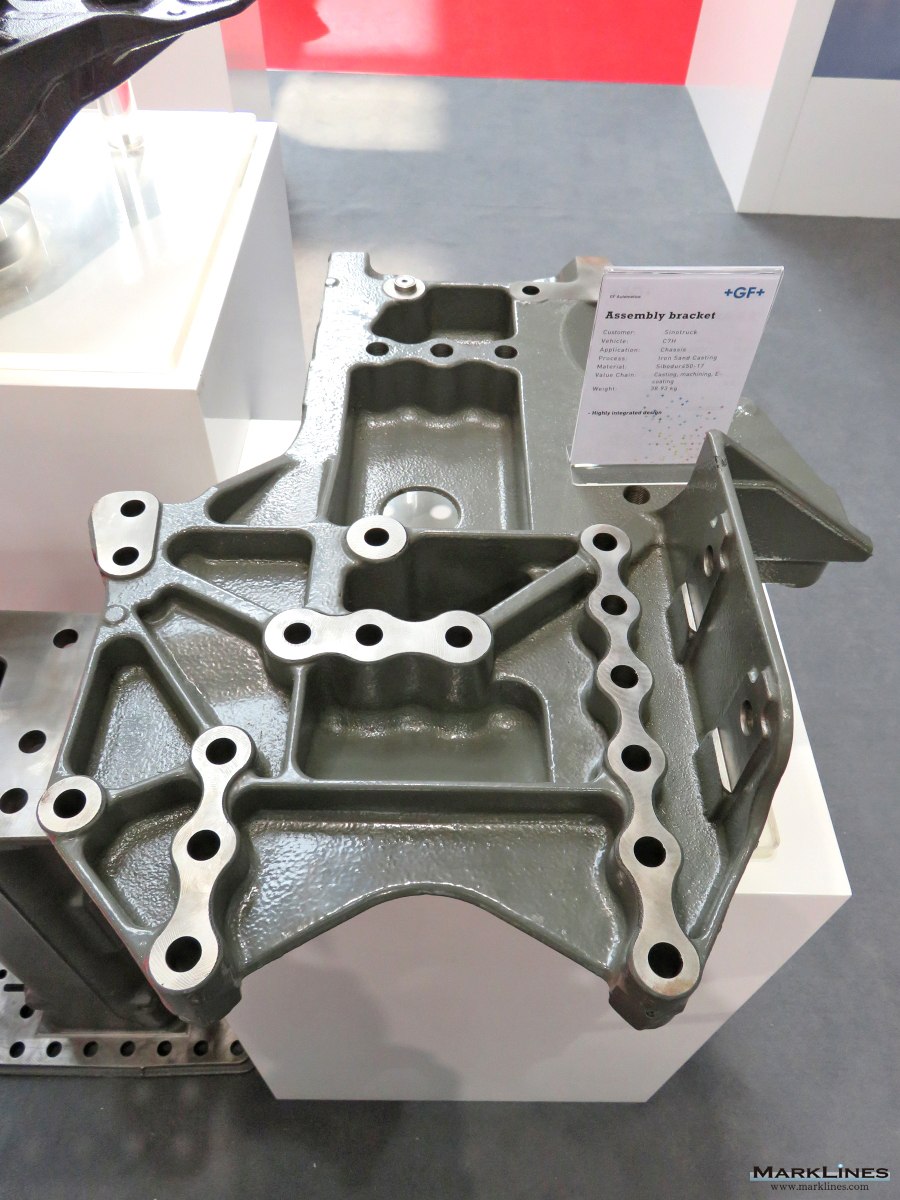
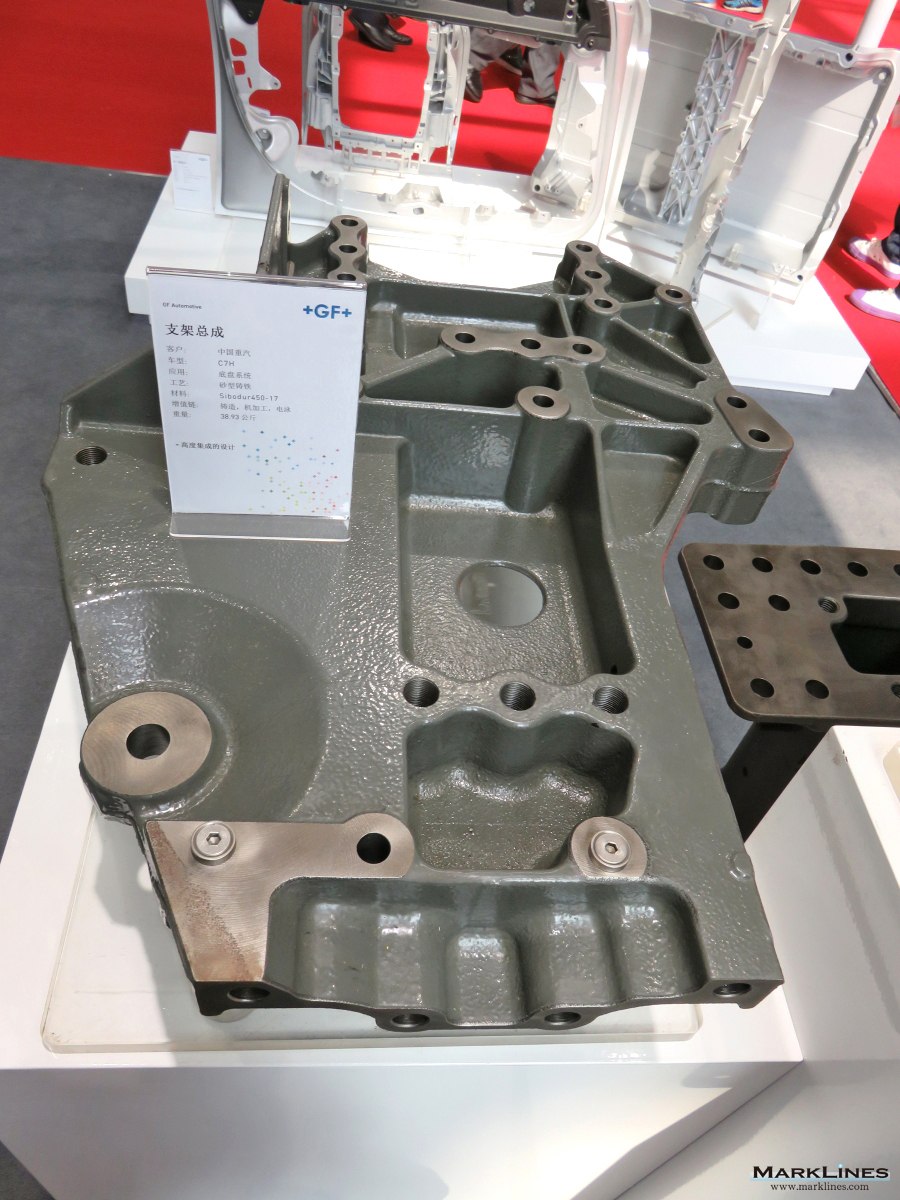
Bracket assembly
 1
1
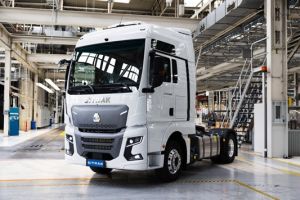
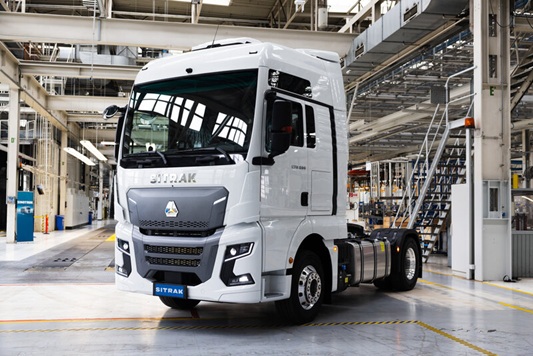
Steyr Automotive, Austria begins truck production for Sinotruk
 1
1
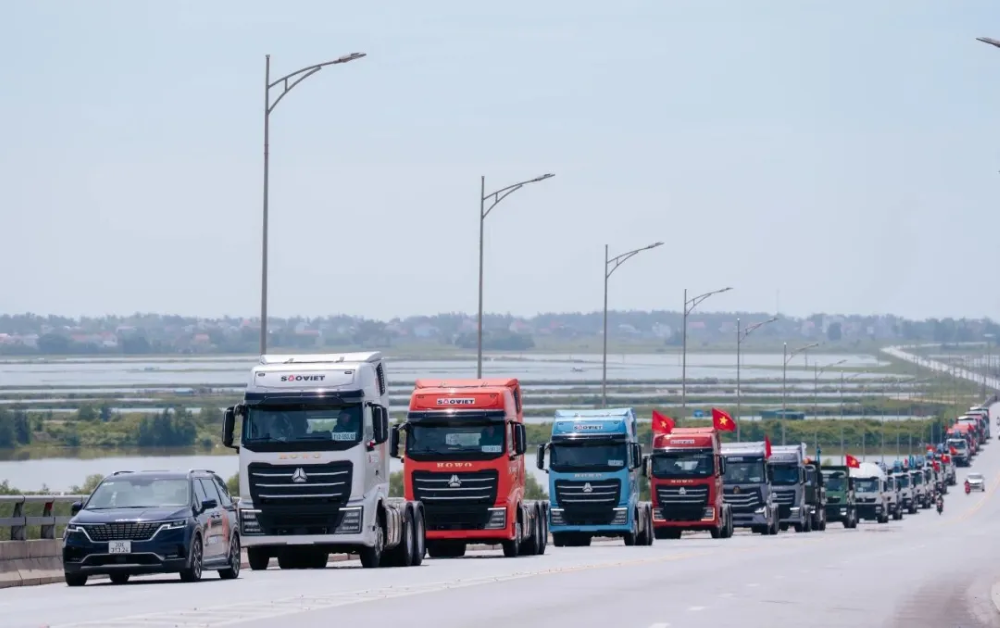
Sinotruk exports 15,000 HDTs in September 2025
 1
1
Saran Machinery and Sinotruk to establish commercial vehicle plant in Kazakhstan
 1
1
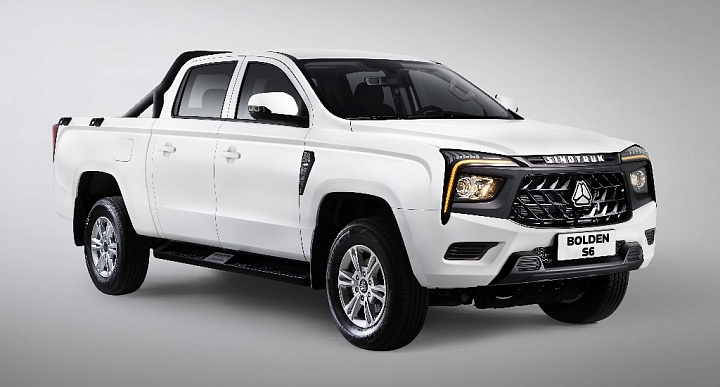
Sinotruk to introduce Bolden S6 pickup truck in Russia
 1
1
SHIG, JD forge strategic partnership for supply chain services
Sort by :
1 - 18 of 18 results
South Africa - New car sales in 2026 by OEM, vehicle type
rrari 7 0.0% Tata 4 0.0% May 2026 Total 48,122 - May 2025 Total 42,679 - Y-o-Y 12.8% - Commercial Maker/Brand May 2026 Share FAW 567 19.2% Toyota 377 12.8% Isuzu 276 9.4% Daimler Trucks and Buses 267 9.1% UD Trucks 229 7.8% Volvo 224 7.6% Scania 206 7.0% MAN 185 6.3% Sinotruk 101 3.4% Powerstar 92 3.1% Foton 77 2.6% Tata 72 2.4% Ford 58 2.0% Mercedes-Benz * 54 1.8% Eicher 41 1.4% DAF 31 1.1% VW 30 1...
Automotive Sales Data Updated at: 2026/06/02
Russia - New car sales in 2026 by OEM, vehicle type
% 69 3.7% 29.0% 255 4.3% 291 4.1% -12.4% Total 1,687 100.0% 1,860 100.0% -9.3% 5,907 100.0% 7,141 100.0% -17.3% Trucks - Maker 2026 2025 Y-o-Y 2026 2025 Y-o-Y Apr. Share Apr. Share Jan.-Apr. Share Jan.-Apr. Share 1 KAMAZ 1,920 38.8% 1,494 30.0% 28.5% 5,819 34.8% 6,016 27.9% -3.3% 2 Sinotruk 481 9.7% 734 14.7% -34.5% 1,818 10.9% 3,844 17.8% -52.7% 3 FAW 344 7.0% 335 6.7% 2.7% 1,175 7.0% 1,529 7.1% -23.2% 4 Maz 316 6.4% 281 5.6...
Automotive Sales Data Updated at: 2026/05/15
Russia - New car sales in 2025 by OEM, vehicle type
8% 90.4% 1,060 4.8% 1,147 3.9% -7.6% Total 2,447 100.0% 2,643 100.0% -7.4% 21,992 100.0% 29,199 100.0% -24.7% Trucks - Maker 2025 2024 Y-o-Y 2025 2024 Y-o-Y Dec. Share Dec. Share Jan.-Dec. Share Jan.-Dec. Share 1 KAMAZ 2,440 36.3% 2,249 25.9% 8.5% 18,333 29.8% 23,121 18.3% -20.7% 2 Sinotruk 954 14.2% 1,153 13.3% -17.3% 9,803 15.9% 25,280 20.0% -61.2% 3 GAZ 505 7.5% 765 8.8% -34.0% 4,698 7.6% 7,543 6.0% -37.7% 4 Shaanxi 370 5....
Automotive Sales Data Updated at: 2026/03/03
South Africa - New car sales in 2025 by OEM, vehicle type
Commercial Maker/Brand Dec. 2025 Share FAW 438 20.8% Isuzu 267 12.7% Toyota 250 11.9% Daimler Trucks and Buses 194 9.2% Volvo 177 8.4% UD Trucks 146 6.9% Scania 131 6.2% Iveco 90 4.3% Mercedes-Benz * 60 2.8% MAN 57 2.7% Ford 47 2.2% Powerstar 43 2.0% Tata 40 1.9% Sinotruk 37 1.8% Eicher 35 1.7% VW 28 1.3% Foton 18 0.9% Hyundai 17 0.8% DAF 14 0.7% Shacman 12 0.6% JAC 7 0.3% Dec.2025 Total 2,108 -...
Automotive Sales Data Updated at: 2026/02/03
South Africa - New car sales in 2024 by OEM, vehicle type
0.1% Subaru 32 0.1% Others 5 0.0% Dec.2024 Total 38,911 - Dec.2023 Total 37,717 - Y-o-Y 3.2% - Commercial Maker/Brand Dec. 2024 Share Toyota 418 17.7% Daimler Trucks and Buses 382 16.2% FAW 274 11.6% Isuzu 244 10.3% Scania 176 7.5% Volvo 151 6.4% UD Trucks 138 5.8% Sinotruk 130 5.5% Ford 87 3.7% MAN 85 3.6% Mercedes-Benz * 63 2.7% Powerstar 48 2.0% VW 47 2.0% Iveco 44 1.9% Tata 37 1.6% Hyundai 17 ...
Automotive Sales Data Updated at: 2025/07/03
New Zealand - Flash report, Automotive sales volume, 2023
14 1.2% 152 0.4% Peugeot 7 0.6% 152 0.4% Renault 6 0.5% 146 0.4% MAN 1 0.1% 143 0.4% Suzuki 2 0.2% 113 0.3% Skoda - -% 54 0.1% Factory Built 15 1.2% 53 0.1% Mack - -% 44 0.1% CRRC - -% 43 0.1% Jeep 2 0.2% 25 0.1% Mahindra & Mahindra - -% 24 0.1% International 1 0.1% 23 0.1% Sinotruk 1 0.1% 17 0.0% Western Star - -% 17 0.0% Alexander Dennis - -% 12 0.0% Freightliner - -% 11 0.0% BCI - -% 8 0.0% Liebherr - -% 7 0....
Automotive Sales Data Updated at: 2025/06/04
South Africa - Flash report, Automotive sales volume, 2023
Maker/Brand Dec. 2023 Share Daimler Trucks and Buses 563 22.1% Isuzu 316 12.4% Toyota 261 10.3% Volvo 257 10.1% Scania 203 8.0% Iveco 153 6.0% UD Trucks 152 6.0% MAN 130 5.1% FAW 128 5.0% Mercedes-Benz * 109 4.3% Tata 72 2.8% Powerstar 49 1.9% Ford 48 1.9% VW 45 1.8% Sinotruk 15 0.6% JAC 13 0.5% DAF 12 0.5% Eicher 11 0.4% Hyundai 5 0.2% Dec.2023 Total 2,542 - Dec.2022 Total 2,500 - Y-o-Y 1.7% - Sou...
Automotive Sales Data Updated at: 2025/06/04
New Zealand - Flash report, Automotive sales volume, 2022
0.3% 287 0.6% Foton 9 0.3% 266 0.5% Chevrolet 19 0.6% 259 0.5% Kenworth 2 0.1% 226 0.5% Volvo 12 0.4% 188 0.4% MAN 8 0.2% 185 0.4% DAF 6 0.2% 151 0.3% Peugeot 8 0.2% 110 0.2% Mahindra & Mahindra 4 0.1% 89 0.2% Jeep - -% 87 0.2% Factory Built 2 0.1% 68 0.1% CRRC - -% 62 0.1% Sinotruk 4 0.1% 53 0.1% Suzuki 4 0.1% 41 0.1% Mack 1 0.0% 27 0.1% Freightliner 1 0.0% 23 0.0% International 2 0.1% 22 0.0% Liebherr - -% 14 ...
Automotive Sales Data Updated at: 2025/06/04
New Zealand - Flash report, Automotive sales volume, 2021
Ram 19 0.4% 308 0.6% Chevrolet 32 0.7% 233 0.4% Kenworth 9 0.2% 230 0.4% UD Trucks 19 0.4% 198 0.4% DAF 16 0.4% 180 0.3% Volvo 5 0.1% 178 0.3% Foton 23 0.5% 173 0.3% MAN 4 0.1% 133 0.3% Mahindra & Mahindra 10 0.2% 110 0.2% Peugeot 8 0.2% 94 0.2% Factory Built 7 0.2% 67 0.1% Sinotruk 5 0.1% 48 0.1% Freightliner 4 0.1% 44 0.1% Suzuki 4 0.1% 34 0.1% Mack - -% 28 0.1% International 1 0.0% 25 0.0% CRRC - -% 24 0.0% ...
Automotive Sales Data Updated at: 2025/06/04
Ireland - Flash report, Sales volume, 2020
5.6% -48.7% FUSO 1 3.4% 3 6.1% -66.7% 51 2.5% 46 1.7% 10.9% HIGER - -% - -% -% 23 1.1% 14 0.5% 64.3% DENNIS EAGLE - -% - -% -% 6 0.3% 16 0.6% -62.5% WRIGHTBUS 3 10.3% 0 0.0% -% 5 0.2% 36 1.4% -86.1% VANHOOL - -% - -% -% 2 0.1% 18 0.7% -88.9% ALEXANDER - -% - -% -% 2 0.1% 8 0.3% -75.0% SINOTRUK - -% - -% -% 0 0.0% 66 2.5% -100.0% HINO - -% - -% -% 0 0.0% 5 0.2% -100.0% VDL DAF - -% - -% -% 0 0.0% 3 0.1% -100.0% ROSENBAUER - -% ...
Automotive Sales Data Updated at: 2025/06/04
New Zealand - Flash report, Sales volume, 2020
1.2% 336 0.9% Scania 20 0.7% 330 0.9% Renault 29 1.0% 255 0.7% Volvo 3 0.1% 229 0.6% Ram 5 0.2% 210 0.5% Kenworth 8 0.3% 164 0.4% DAF 7 0.2% 157 0.4% UD Trucks 12 0.4% 144 0.4% Foton 6 0.2% 88 0.2% MAN 3 0.1% 85 0.2% Mahindra & Mahindra 12 0.4% 84 0.2% Peugeot 4 0.1% 80 0.2% Sinotruk 3 0.1% 52 0.1% Chevrolet - -% 42 0.1% Mack 1 0.0% 38 0.1% Freightliner 4 0.1% 34 0.1% International 4 0.1% 27 0.1% Elddis 2 0.1% 25...
Automotive Sales Data Updated at: 2025/06/04
New Zealand - Flash report, Sales volume, 2019
28 0.9% 463 0.9% Great Wall 20 0.7% 407 0.8% Iveco 25 0.8% 348 0.7% Volvo 6 0.2% 306 0.6% Renault 13 0.4% 270 0.5% Kenworth 11 0.4% 266 0.5% UD Trucks 21 0.7% 260 0.5% Scania 20 0.7% 254 0.5% DAF 13 0.4% 239 0.5% Foton 5 0.2% 205 0.4% Ram 10 0.3% 152 0.3% MAN 5 0.2% 136 0.3% Sinotruk 7 0.2% 107 0.2% Mahindra & Mahindra 2 0.1% 95 0.2% Alexander Dennis - -% 63 0.1% Mack 1 0.0% 60 0.1% Peugeot 2 0.1% 56 0.1% Freight...
Automotive Sales Data Updated at: 2020/01/10
Ireland - Flash report, Sales volume, 2019
350.0% 411 15.5% 450 17.4% -8.7% MERCEDES-BENZ 0 0.0% 1 1.9% -100.0% 286 10.8% 199 7.7% 43.7% RENAULT 24 47.1% 0 0.0% -% 283 10.7% 196 7.6% 44.4% IVECO 1 2.0% 1 1.9% 0.0% 151 5.7% 120 4.6% 25.8% MAN 2 3.9% 5 9.6% -60.0% 142 5.4% 163 6.3% -12.9% ISUZU - -% - -% -% 76 2.9% 99 3.8% -23.2% SINOTRUK - -% - -% -% 66 2.5% 8 0.3% 725.0% WRIGHTBUS - -% - -% -% 36 1.4% 57 2.2% -36.8% FUSO 3 5.9% 1 1.9% 200.0% 34 1.3% 72 2.8% -52.8% VANHO...
Automotive Sales Data Updated at: 2020/01/07
New Zealand - Flash report, Sales volume, 2018
.5% Scania 3 0.1% 240 0.4% MAN 6 0.2% 189 0.4% Factory Built 2 0.1% 185 0.3% Alexander Dennis 22 0.6% 150 0.3% BCI 1 0.0% 108 0.2% Mahindra & Mahindra 7 0.2% 98 0.2% Freightliner 5 0.1% 74 0.1% Mack - -% 65 0.1% Peugeot 2 0.1% 60 0.1% Suzuki 6 0.2% 49 0.1% Ram 2 0.1% 44 0.1% Sinotruk 2 0.1% 37 0.1% International - -% 24 0.0% Western Star 1 0.0% 22 0.0% Chevrolet 1 0.0% 21 0.0% Zhengzhou Yutong Bus - -% 12 0.0% Li...
Automotive Sales Data Updated at: 2019/01/11
Ireland - Flash report, Sales volume, 2018
% 48 1.8% 50.0% WRIGHTBUS - -% - -% -% 57 2.2% 2 0.1% 2750.0% VDL DAF 0 0.0% 3 2.4% -100.0% 20 0.8% 50 1.9% -60.0% VANHOOL - -% - -% -% 17 0.7% 17 0.7% 0.0% DENNIS EAGLE - -% - -% -% 15 0.6% 7 0.3% 114.3% HIGER - -% - -% -% 14 0.5% 8 0.3% 75.0% HINO - -% - -% -% 13 0.5% 21 0.8% -38.1% SINOTRUK 0 0.0% 8 6.3% -100.0% 8 0.3% 25 1.0% -68.0% PEUGEOT - -% - -% -% 4 0.2% 0 0.0% -% ALEXANDER - -% - -% -% 1 0.0% 0 0.0% -% VOLKSWAGEN - ...
Automotive Sales Data Updated at: 2019/01/07
New Zealand - Flash report, Sales volume, 2017
9 0.4% MAN 8 0.2% 228 0.4% Factory Built 23 0.7% 187 0.4% Renault 10 0.3% 184 0.4% Great Wall 10 0.3% 169 0.3% Freightliner 13 0.4% 70 0.1% Mack 3 0.1% 62 0.1% Mahindra & Mahindra 2 0.1% 59 0.1% Ram 6 0.2% 52 0.1% Suzuki 6 0.2% 52 0.1% BCI - -% 47 0.1% Peugeot 3 0.1% 42 0.1% Sinotruk 5 0.1% 31 0.1% International 1 0.0% 25 0.0% Western Star 1 0.0% 25 0.0% Alexander Dennis - -% 25 0.0% Higer 1 0.0% 15 0.0% King Lon...
Automotive Sales Data Updated at: 2018/07/24
Ireland - Flash report, Sales volume, 2017
17.2% 140.0% 247 9.5% 266 9.3% -7.1% IVECO 27 21.6% 1 3.4% 2600.0% 153 5.9% 114 4.0% 34.2% MAN 4 3.2% 10 34.5% -60.0% 148 5.7% 241 8.4% -38.6% ISUZU 2 1.6% 1 3.4% 100.0% 77 3.0% 99 3.4% -22.2% VDL DAF 3 2.4% 0 0.0% -% 50 1.9% 17 0.6% 194.1% FUSO 1 0.8% 1 3.4% 0.0% 48 1.8% 50 1.7% -4.0% SINOTRUK 8 6.4% 0 0.0% -% 25 1.0% 0 0.0% -% HINO - -% - -% -% 21 0.8% 44 1.5% -52.3% VANHOOL - -% - -% -% 17 0.7% 22 0.8% -22.7% HIGER - -% - -%...
Automotive Sales Data Updated at: 2018/07/24
New Zealand - Flash report, Sales volume, 2016
0.0% 55 0.1% Peugeot - -% 54 0.1% Alexander Dennis - -% 40 0.1% Ram 5 0.2% 28 0.1% Suzuki - -% 27 0.1% Western Star 2 0.1% 24 0.1% International 1 0.0% 21 0.0% Great Wall 2 0.1% 18 0.0% Caterpillar - -% 14 0.0% Designline - -% 10 0.0% King Long - -% 8 0.0% Higer - -% 7 0.0% Sinotruk 1 0.0% 5 0.0% JAC - -% 5 0.0% Grove 3 0.1% 4 0.0% GMC 1 0.0% 3 0.0% Terex 1 0.0% 3 0.0% Chevrolet - -% 3 0.0% Tadano - -% 3 0.0% ...
Automotive Sales Data Updated at: 2017/01/16


 Japan
Japan USA
USA Mexico
 Germany
 China (Shanghai)
 Thailand
 India
India