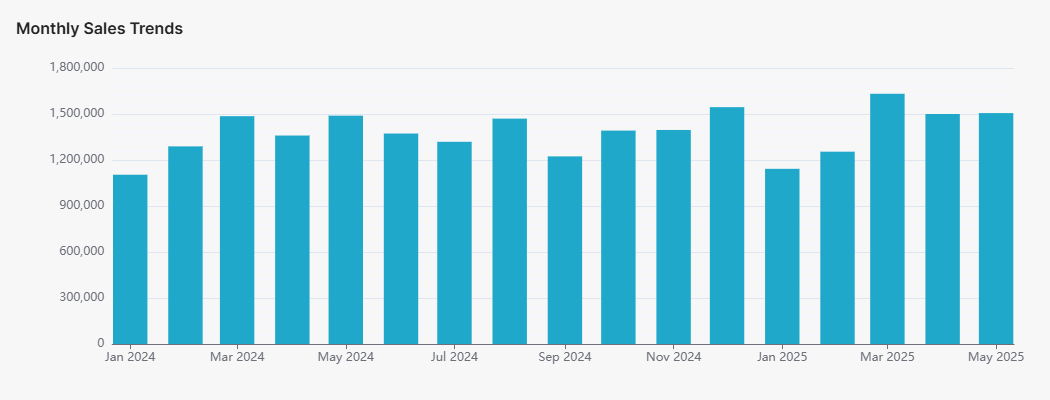
US Automotive Sales (Monthly & by Model) – Latest Data, September 2025
Overview:
MarkLines’ “US Automotive Sales (Monthly & by Model)” provides detailed aggregated data for January 2024–September 2025, broken down by manufacturer, model, country, powertrain, and segment. Updated monthly, it supports multi-angle analysis of each maker’s market share, growth/decline trends, and year-on-year comparisons—an essential source for market forecasting, competitive analysis, and marketing strategy decisions.
U.S. new vehicle sales in September 2025 were solid, rising 5.8% year-over-year to 1.252 million units. The market was boosted by rush-buying of EVs ahead of the tax credit expiration at the end of September, with the three major U.S. automakers—GM, Ford, and Stellantis—performing particularly well. Light trucks drove the market, while passenger car sales declined.

 AI Navigator


 Japan
Japan USA
USA Mexico
 Germany
 China (Shanghai)
 Thailand
 India
India