


Search Results by Category
All information related to {{ key_word }}.
AI Navigator will guide you. Click here for information about {{ key_word }}.
Images
 1
1
Thai BOI auto and parts investment applications reach THB 70.98 billion in Jan–Sep 2025
 7
7
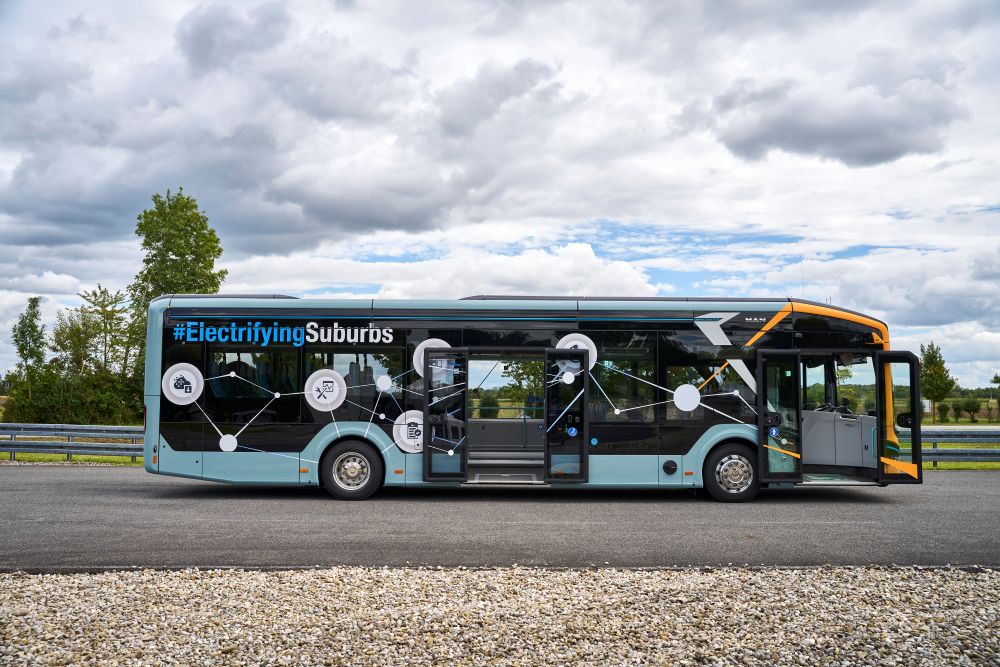
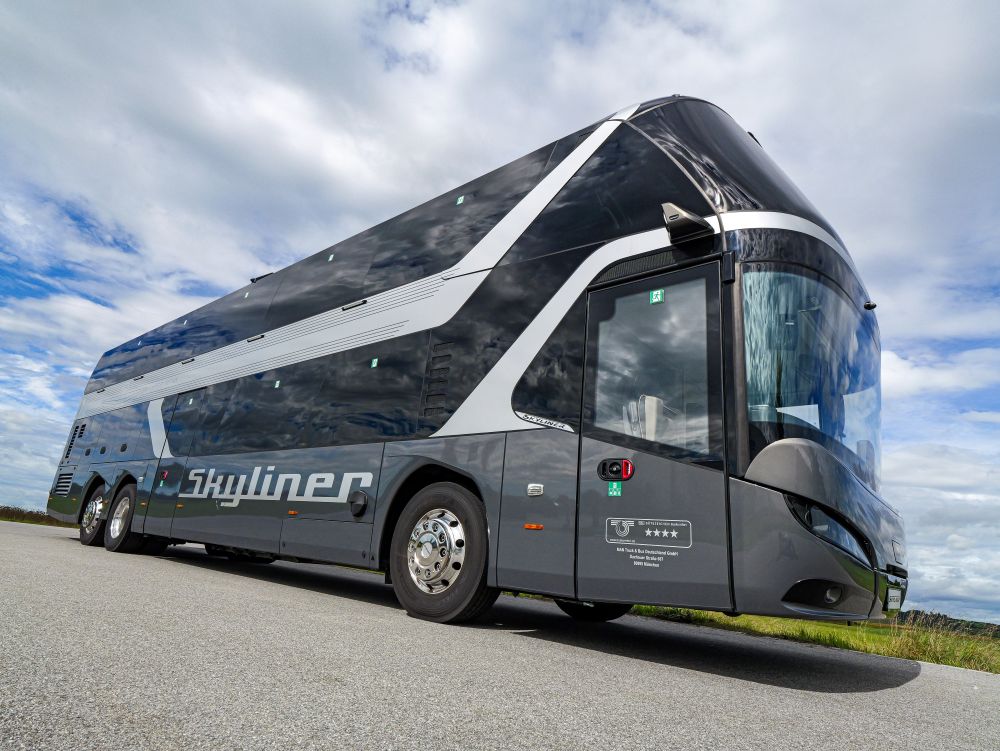
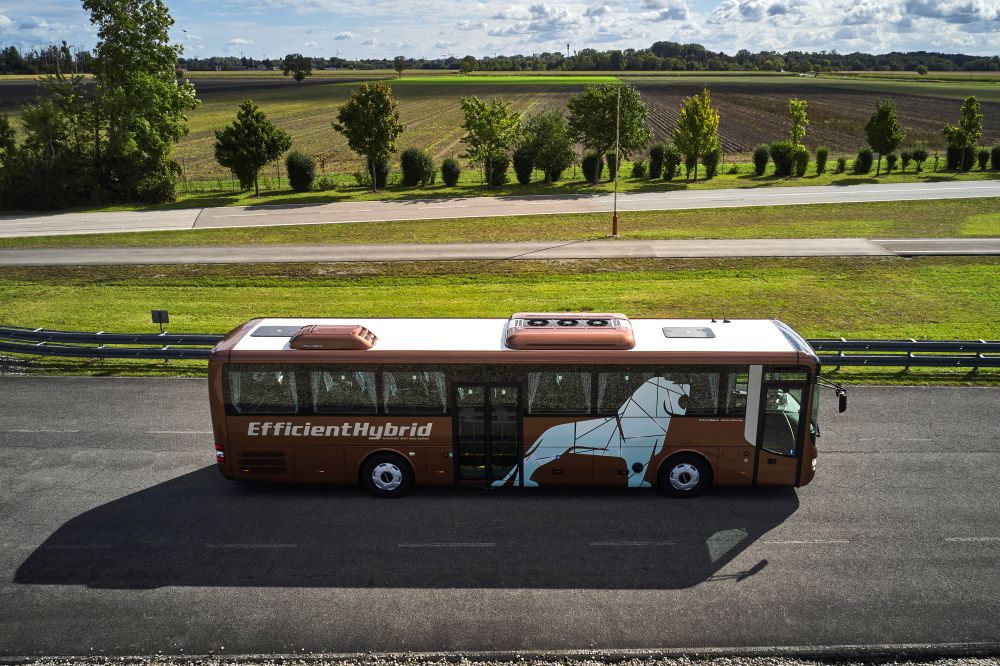
MAN Truck & Bus unveils electric coaches and other models at Busworld Europe 2025
 4
4
BYD launches trial operation of Q3 electric heavy-duty truck in Shanghai
 1
1
First phase of Inovance NEV component manufacturing site in Suzhou topped out
 3
3
Ford launches 2025 Taurus in Middle East
 1
1
Chery South Africa introduces new DCT gearbox in Tiggo 4 Pro
 1
1
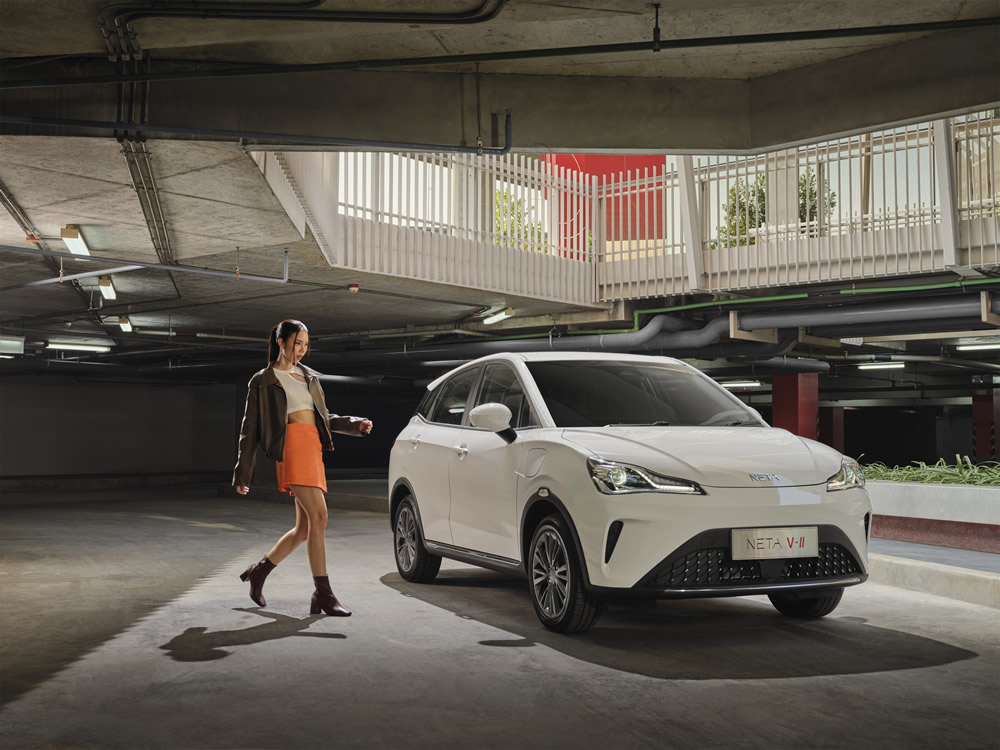
BIMS 2024: NETA V-II officially launched in Thailand; deliveries to start in June 2024
Sort by :
1 - 20 of 294 results
GlobalData European Passenger Car Sales Update (February 2026)
,000 262,949 390,883 -32.7% NORWAY 7,272 8,949 -18.7% 9,490 18,292 -48.1% 95,037 62,326 179,750 -65.3% PORTUGAL 20,541 19,463 5.5% 37,380 33,967 10.0% 243,331 241,021 225,039 7.1% SPAIN 97,082 90,327 7.5% 170,185 162,649 4.6% 1,139,472 1,081,803 1,148,597 -5.8% SWEDEN 19,341 19,608 -1.4% 35,382 39,240 -9.8% 270,758 267,888 273,167 -1.9% SWITZERLAND 15,697 16,212 -3.2% 29,724 31,000 -4.1% 217,813 219,109 233,737 -6.3% UK 90,100 84,054 ...
Market & Tech Reports Updated at: 2026/03/09
Global Top 10 Countries Sales Forecast (Q4 2025)
86,847,703 88,773,650 92,135,741 93,740,506 93,596,587 China 23,874,383 25,236,335 25,483,303 27,288,530 27,634,774 26,466,561 USA 13,775,954 15,552,193 15,932,812 16,238,767 16,139,339 16,187,800 India 4,391,233 4,713,369 4,893,644 5,155,910 5,468,440 5,599,907 Japan 4,166,415 4,744,288 4,382,841 4,531,086 4,737,079 4,686,802 Germany 2,878,586 3,102,405 3,099,669 3,098,302 3,121,772 3,187,633 Brazil 1,959,055 2,178,928 2,481,953 2,5...
Market & Tech Reports Updated at: 2026/01/30
Analysis of India’s Two-Wheeler Production and Manufacturing Capacity
EM (FY2024-25)(Source: Created by MarkLines based on various press releases and sources) Scooter The table can be scrolled left and right. OEM FY 2023-24 FY 2024-25 YoY Change Share Honda 2,800 3,155 12.7% 47.5% TVS 1,398 1,624 16.2% 24.4% Suzuki 962 1,080 12.3% 16.2% Yamaha 321 382 19.0% 5.7% Hero 401 360 -10.2% 5.4% Piaggio 53 47 -11.3% 0.7% Total 5935 6649 12.0% (Source: Created by MarkLines based on various pres...
Market & Tech Reports Updated at: 2026/01/30
GlobalData Global Light Vehicle Sales Update (December 2025)
618 1,810,266 3.2% 1,941,403 1,867,618 1,810,266 3.2% WESTERN EUROPE 1,169,927 1,133,833 3.2% 13,416,422 13,370,099 0.3% 15,074,251 13,416,422 13,370,099 0.3% EASTERN EUROPE 513,048 479,742 6.9% 4,691,409 4,674,209 0.4% 4,880,136 4,691,409 4,674,209 0.4% JAPAN 332,665 326,443 1.9% 4,528,323 4,382,841 3.3% 4,586,642 4,528,323 4,382,841 3.3% KOREA 144,798 140,688 2.9% 1,654,978 1,598,873 3.5% 1,531,096 1,654,978 1,598,873 3.5% CHINA 2,504...
Market & Tech Reports Updated at: 2026/01/21
Thailand International Motor Expo 2025 (1) Chinese Manufacturers
cased models, the new XPeng G6 Standard Range stands out with its futuristic exterior design, featuring the iconic Robot Face and a Full-Width Integrated Daytime Running Light. Powered by an 800V 5C AI Battery Ultra-Fast Charging LFP pack with a 68.5 kWh capacity, it supports DC fast charging up to 382 kW, going from 10–80% in just 12 minutes, and delivers a maximum range of 540 km (NEDC) on a full charge. The XPeng X9 Luxury Special Color E...
Market & Tech Reports Updated at: 2026/01/16
Tesla: Struggling with Slowing U.S. BEV Demand and Intensifying Competition in China
4 43,274 38,342 36,588 39,660 France 28,875 62,960 40,722 28,291 30,141 30,216 33,377 Germany 69,963 63,685 37,574 19,639 20,935 20,420 30,312 Korea 14,571 16,459 29,750 51,603 25,201 25,237 24,146 Turkey 0 12,000 11,534 39,060 29,988 26,371 20,262 Australia 19,594 46,116 38,347 27,801 25,382 22,433 18,681 Chinese Taipei 11,527 13,159 15,271 15,052 16,599 18,221 18,515 Norway 21,204 25,249 24,115 30,189 21,037 19,836 15,450 Nether...
Market & Tech Reports Updated at: 2026/01/14
Global Motorcycle Production and Sales: India, China, and ASEAN
2,605 1,370,417 1,902,415 1,826,467 1,185,532 1,150,090 1,514,718 Taiwan 1,175,259 1,118,848 1,217,442 1,237,080 1,088,657 1,027,867 1,297,680 1,163,921 1,070,231 1,089,207 1,012,084 Japan 597,058 522,394 560,536 646,983 651,884 567,376 484,596 646,954 694,968 682,828 639,383 Malaysia 440,157 382,218 397,918 440,673 465,083 553,382 492,490 496,136 685,828 549,481 566,175 Europe (Note 4) 511,375 439,743 447,878 511,567 491,872 516,196 461,...
Market & Tech Reports Updated at: 2025/12/25
Analysis Report: Cockpit Module (Chinese Market)
scal year 2024 2023 2022 2021 2020 Total operating revenues(EUR millions) 26,974 27,248 25,458 15,618 14,445 Total operating costs(EUR millions) 23,371 23,586 22,234 13,734 12,972 Net income(EUR millions) -7 373 -262 137 -290 Net income attributable to parent company(EUR millions) -185 222 -382 -79 -379 3.5 Harman International Recent developments 3.5.1 Corporate profile and management strategy Harman International Industries, Inc...
Market & Tech Reports Updated at: 2025/12/24
GlobalData Global Light Vehicle Sales Update (November 2025)
0 1,810,266 3.3% WESTERN EUROPE 1,090,903 1,086,048 0.4% 12,248,287 12,236,266 0.1% 14,446,849 13,499,141 13,370,099 1.0% EASTERN EUROPE 428,842 418,317 2.5% 4,173,694 4,194,467 -0.5% 4,986,217 4,717,981 4,674,209 0.9% JAPAN 366,806 386,901 -5.2% 4,195,488 4,056,398 3.4% 4,599,736 4,599,696 4,382,841 4.9% KOREA 146,084 145,429 0.5% 1,512,637 1,458,185 3.7% 1,752,836 1,669,434 1,598,873 4.4% CHINA 2,669,066 2,822,987 -5.5% 24,404,736 22,...
Market & Tech Reports Updated at: 2025/12/19
Analysis Report: EV/HV Drive Motor (Chinese Market)
D drive motor sales volume in June 2025 The table can be scrolled left and right. NEV models June 2024 June 2025 Rate of increase - Passenger cars 340,211 377,600 11.0% - BEVs 145,179 206,800 42.4% - PHEVs 195,032 170,700 -12.5% - Commercial vehicles 1,447 4,957 242.6% Total 341,658 382,457 10.5% Table 3.3: 2020 - 2024 BYD Group financial results The table can be scrolled left and right. Fiscal year 2020 2021 2022 202...
Market & Tech Reports Updated at: 2025/12/11
GlobalData European Passenger Car Sales Update (November 2025)
838 1,123 -25.4% 124,908 121,242 3.0% 131,546 131,352 121,665 8.0% ITALY 124,222 124,297 -0.1% 1,416,994 1,452,989 -2.5% 1,641,175 1,528,863 1,558,704 -1.9% LUXEMBOURG 3,576 3,455 3.5% 43,871 43,520 0.8% 49,145 47,235 46,635 1.3% NETHERLANDS 35,601 34,434 3.4% 342,298 346,485 -1.2% 413,494 382,827 383,572 -0.2% NORWAY 19,899 11,689 70.2% 144,562 115,035 25.7% 243,322 158,741 128,687 23.4% PORTUGAL 16,459 19,378 -15.1% 204,160 195,887...
Market & Tech Reports Updated at: 2025/12/10
GlobalData Global Light Vehicle Sales Update (October 2025)
4 1,810,266 3.7% WESTERN EUROPE 1,104,774 1,072,185 3.0% 11,161,047 11,150,218 0.1% 13,559,356 13,409,178 13,370,099 0.3% EASTERN EUROPE 449,963 425,991 5.6% 3,735,710 3,776,150 -1.1% 4,986,875 4,681,092 4,674,209 0.1% JAPAN 392,006 399,466 -1.9% 3,828,190 3,669,497 4.3% 5,237,673 4,599,192 4,382,841 4.9% KOREA 126,809 142,960 -11.3% 1,367,598 1,312,756 4.2% 1,651,746 1,662,686 1,598,873 4.0% CHINA 2,639,214 2,503,353 5.4% 21,769,548 19...
Market & Tech Reports Updated at: 2025/11/21
Chinese market : Chinese OEMs take 70% share as foreign OEMs struggle
417,645 413,495 414,771 Zeekr Zeekr 72,062 123,077 225,292 205,636 277,659 305,460 331,124 Volvo Volvo 181,743 194,045 250,428 197,314 190,671 177,956 182,536 Geometry Geometry 123,816 190,538 177,598 180,050 127,456 112,864 111,478 Yuancheng Yuancheng 37,545 69,909 60,356 64,507 48,609 50,382 51,863 Radar Radar 0 3,256 7,698 17,177 20,674 22,269 24,351 Polestar Polestar 47,253 55,544 69,907 61,856 62,036 58,440 23,594 Maple Maple ...
Market & Tech Reports Updated at: 2025/11/14
GlobalData European Passenger Car Sales Update (October 2025)
9 4.9% SPAIN 96,785 83,472 15.9% 951,445 828,305 14.9% 1,205,870 1,126,914 1,016,990 10.8% SWEDEN 24,078 25,026 -3.8% 228,285 218,417 4.5% 268,085 279,220 269,498 3.6% SWITZERLAND 18,451 18,753 -1.6% 187,378 194,473 -3.6% 223,156 228,957 239,525 -4.4% UK 144,948 144,288 0.5% 1,723,120 1,658,382 3.9% 2,119,725 2,123,153 1,952,778 8.7% Notes: Austria, Greece, & Luxembourg data: estimate for latest month.Greece data source has changed to S...
Market & Tech Reports Updated at: 2025/11/11
Global Top 10 Countries Sales Forecast (Q3 2025)
86,849,211 88,795,139 90,993,202 92,719,431 92,809,652 China 23,874,383 25,236,335 25,483,303 27,350,936 27,634,728 26,466,492 USA 13,775,954 15,552,193 15,951,090 15,823,905 15,844,664 15,909,778 India 4,391,233 4,713,369 4,893,644 5,054,475 5,308,666 5,469,785 Japan 4,166,415 4,744,288 4,382,841 4,660,264 4,753,979 4,686,773 Germany 2,878,586 3,102,405 3,099,669 3,050,205 3,081,412 3,173,675 Brazil 1,959,055 2,178,928 2,481,953 2,5...
Market & Tech Reports Updated at: 2025/10/29
GlobalData Global Light Vehicle Sales Update (September 2025)
1,810,266 3.3% WESTERN EUROPE 1,274,060 1,168,975 9.0% 10,054,180 10,078,033 -0.2% 13,547,632 13,389,543 13,370,099 0.1% EASTERN EUROPE 398,598 372,913 6.9% 3,286,109 3,350,159 -1.9% 4,880,625 4,647,574 4,674,209 -0.6% JAPAN 424,731 434,872 -2.3% 3,435,823 3,270,031 5.1% 4,594,881 4,527,821 4,382,841 3.3% KOREA 157,070 128,508 22.2% 1,243,523 1,169,796 6.3% 1,737,621 1,667,245 1,598,873 4.3% CHINA 2,544,887 2,267,571 12.2% 19,141,929 17...
Market & Tech Reports Updated at: 2025/10/21
Honda: HEVs thriving in North America and Japan
,000 200,752 Accord Sedan (1982-2025 planned), Accord Hybrid Sedan (2013-2025 planned), Integra (2022-), Acura RSX (2025-) East Liberty 2,600 240,000 214,577 CR-V, CR-V Hybrid (2022-), Acura RDX (2012-), MDX (2017-), EV (2025- planned), Sony Honda Mobility AFEELA 1 (2026- planned) PMC 100 2,000 382 CR-V e:FCEV (2024-) Alabama Lincoln 4,500 350,000 345,411 Odyssey, Ridgeline, Pilot, Passport (2018-) Indiana Greensburg 2,600 250,000 243,627...
Market & Tech Reports Updated at: 2025/09/26
GlobalData Global Light Vehicle Sales Update (August 2025)
ht Vehicle Sales Sales(units) Selling rate(Units/year) Aug2025 Aug2024 PercentChange Year to date2025 Year to date2024 PercentChange Aug2025 Year to date2025 Year2024 PercentChange WORLD 7,192,153 6,911,697 4.1% 59,054,053 56,356,452 4.8% 94,468,921 91,296,043 88,775,019 2.8% USA 1,474,382 1,421,899 3.7% 11,019,851 10,559,227 4.4% 16,051,815 16,286,836 15,951,093 2.1% CANADA 156,024 161,293 -3.3% 1,274,730 1,220,018 4.5% 1,693,374 ...
Market & Tech Reports Updated at: 2025/09/22
GlobalData Global Light Vehicle Sales Update (July 2025)
1,810,266 3.8% WESTERN EUROPE 1,086,186 1,048,510 3.6% 7,999,692 8,143,585 -1.8% 13,199,001 13,144,129 13,367,709 -1.7% EASTERN EUROPE 384,997 375,816 2.4% 2,520,981 2,615,384 -3.6% 4,481,507 4,639,088 4,676,421 -0.8% JAPAN 387,180 401,712 -3.6% 2,712,270 2,509,904 8.1% 4,503,776 4,577,720 4,382,841 4.4% KOREA 146,154 130,158 12.3% 959,876 915,482 4.8% 1,646,947 1,652,674 1,598,873 3.4% CHINA 1,969,594 1,803,385 9.2% 14,356,004 12,948,...
Market & Tech Reports Updated at: 2025/08/20
Global Top 10 Countries Sales Forecast (Q2 2025)
86,848,745 88,806,919 89,928,088 90,363,648 92,413,369 China 23,874,383 25,236,335 25,485,734 26,847,338 25,962,452 26,301,479 USA 13,775,954 15,552,193 15,952,693 15,171,564 15,065,748 15,509,802 India 4,391,202 4,713,369 4,893,644 5,019,970 5,268,919 5,470,897 Japan 4,166,415 4,744,288 4,382,841 4,932,033 4,999,995 4,904,745 Germany 2,878,586 3,102,405 3,099,669 3,020,430 3,081,712 3,183,179 Brazil 1,959,055 2,178,928 2,481,953 2,5...
Market & Tech Reports Updated at: 2025/07/28


 Japan
Japan USA
USA Mexico
 Germany
 China (Shanghai)
 Thailand
 India
India