


Search Results by Category
All information related to {{ key_word }}.
AI Navigator will guide you. Click here for information about {{ key_word }}.
Images
 7
7
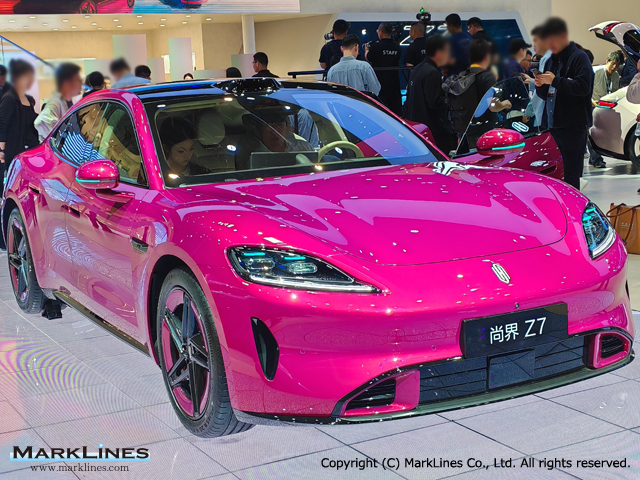
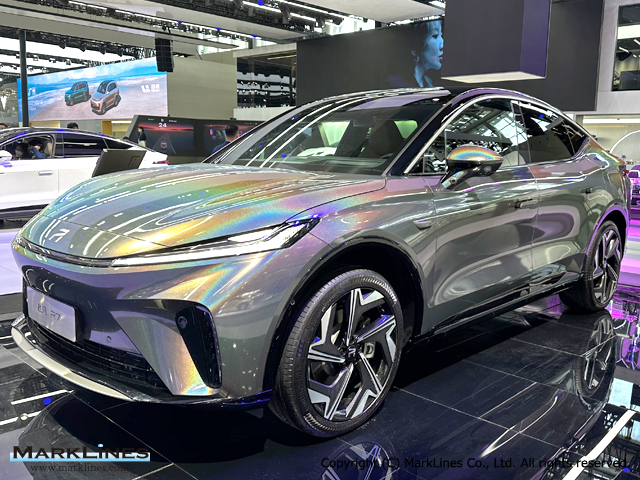
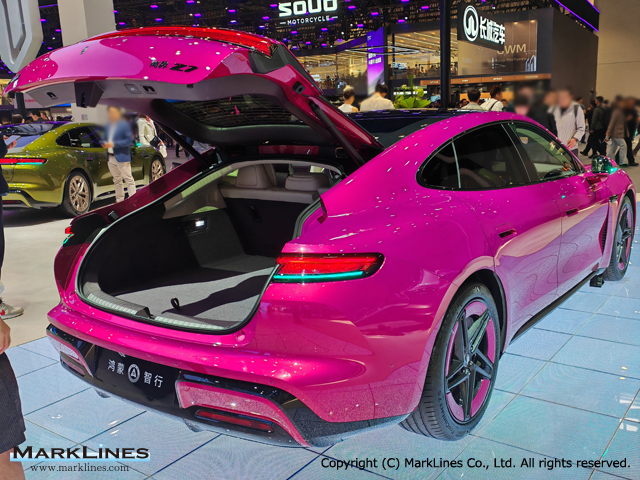
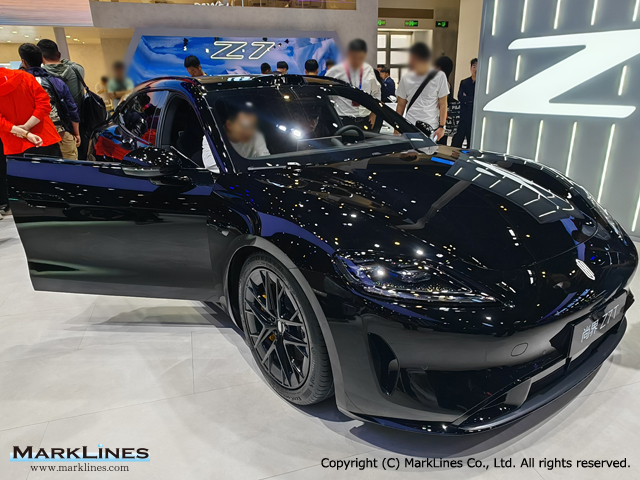
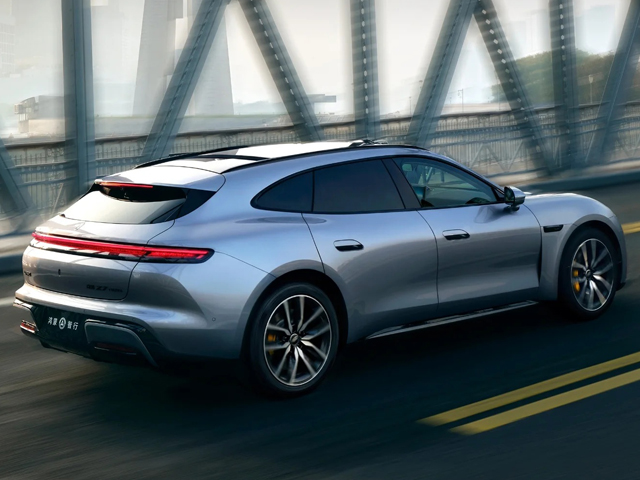
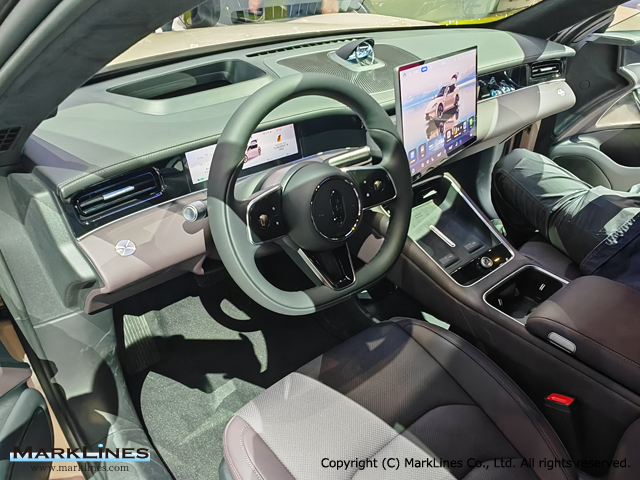
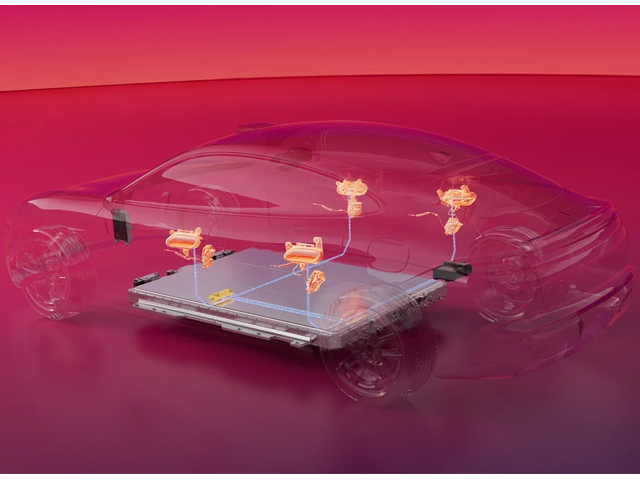
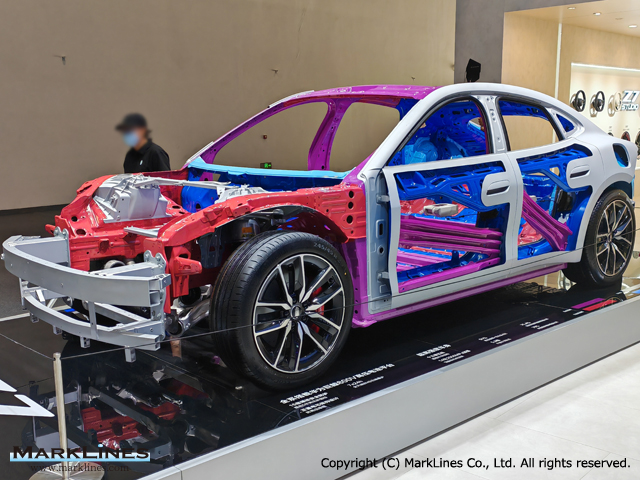
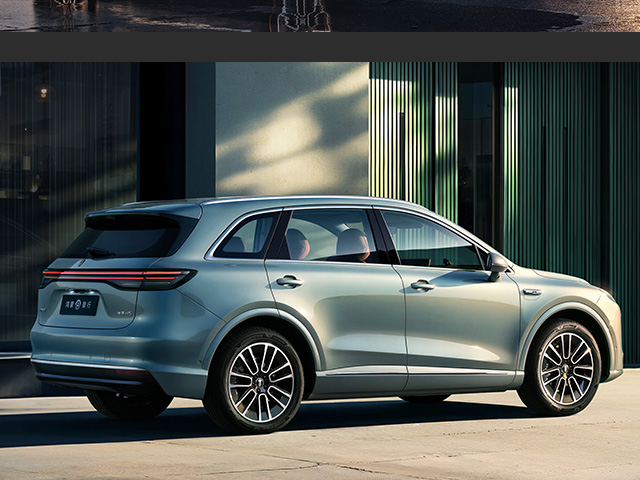
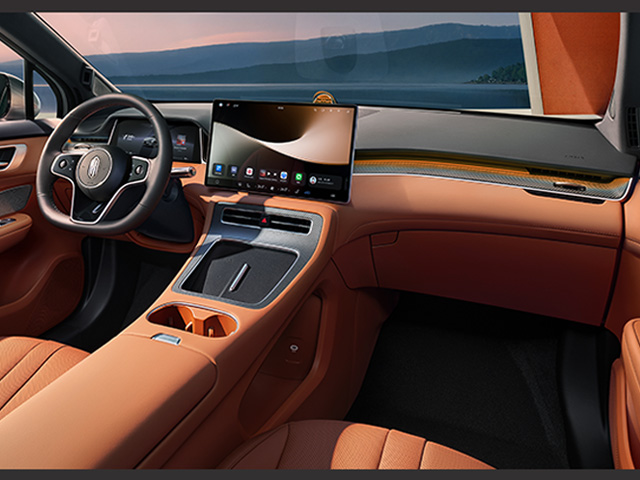
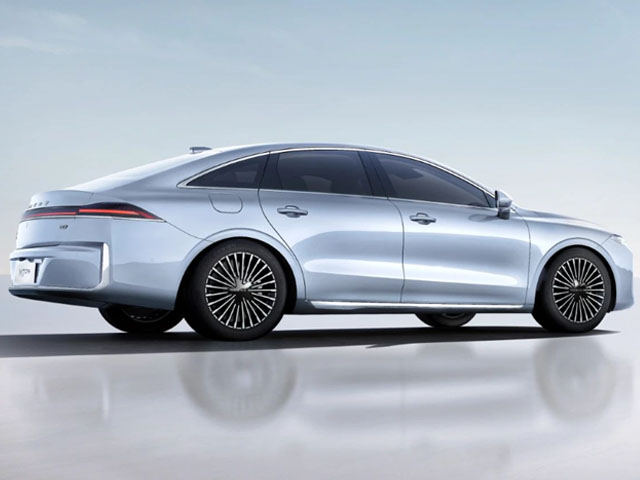
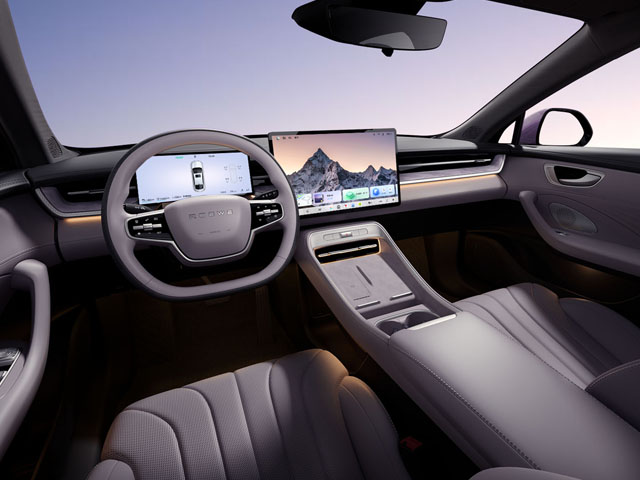
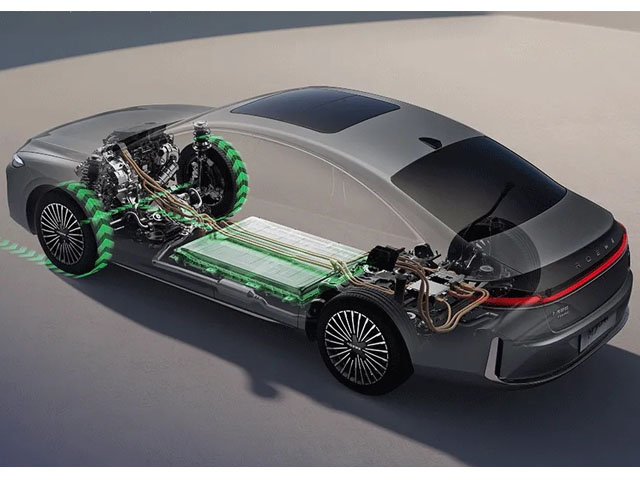
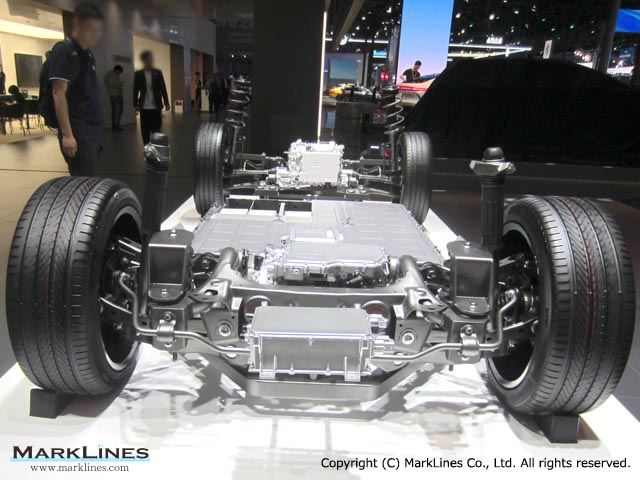
Shangjie Z7/Z7T
 3
3
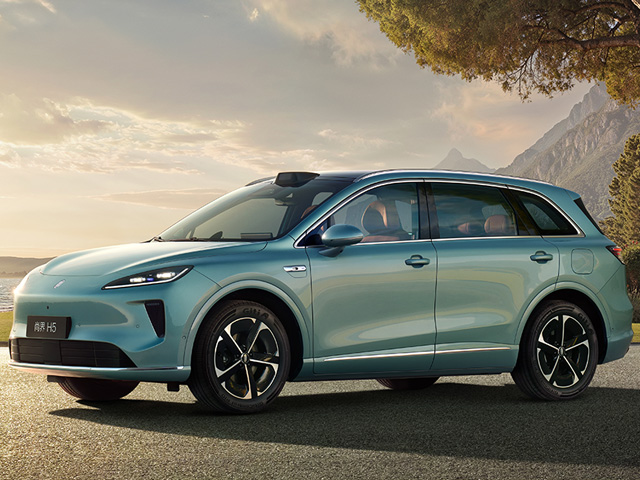
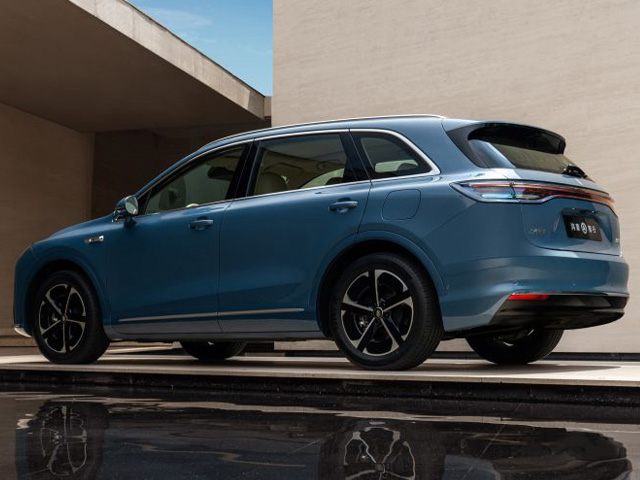
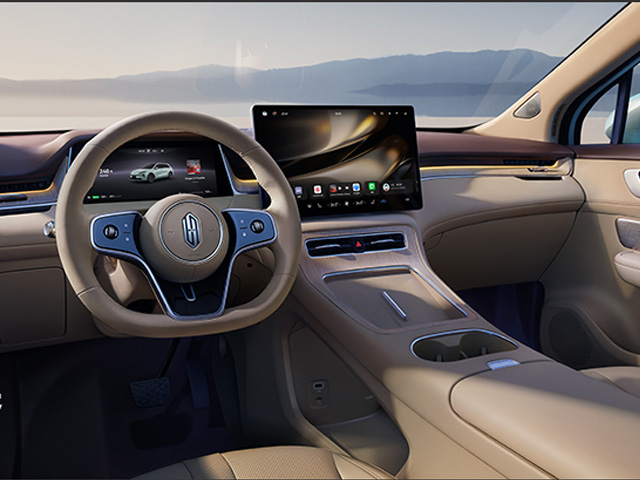
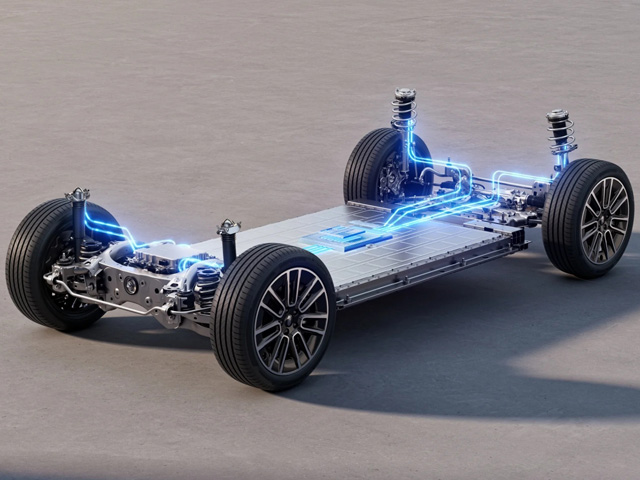
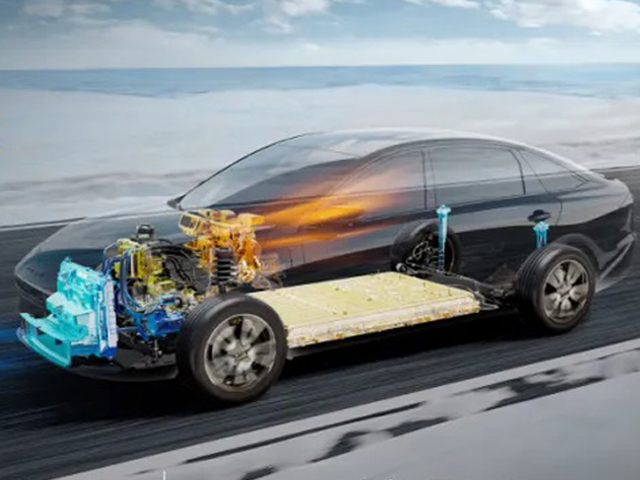
Shangjie H5 EVR
 4
4
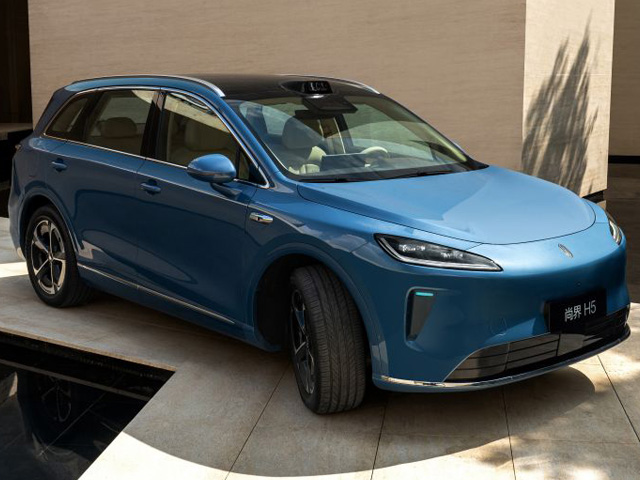
Shangjie H5 EV
 4
4
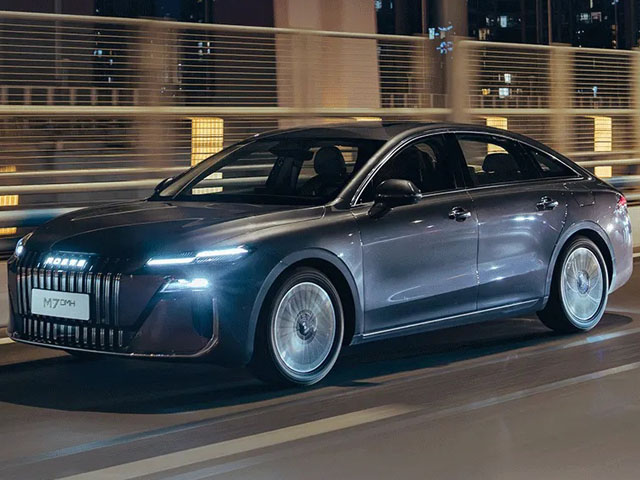
Roewe M7 DMH
 1
1
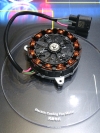
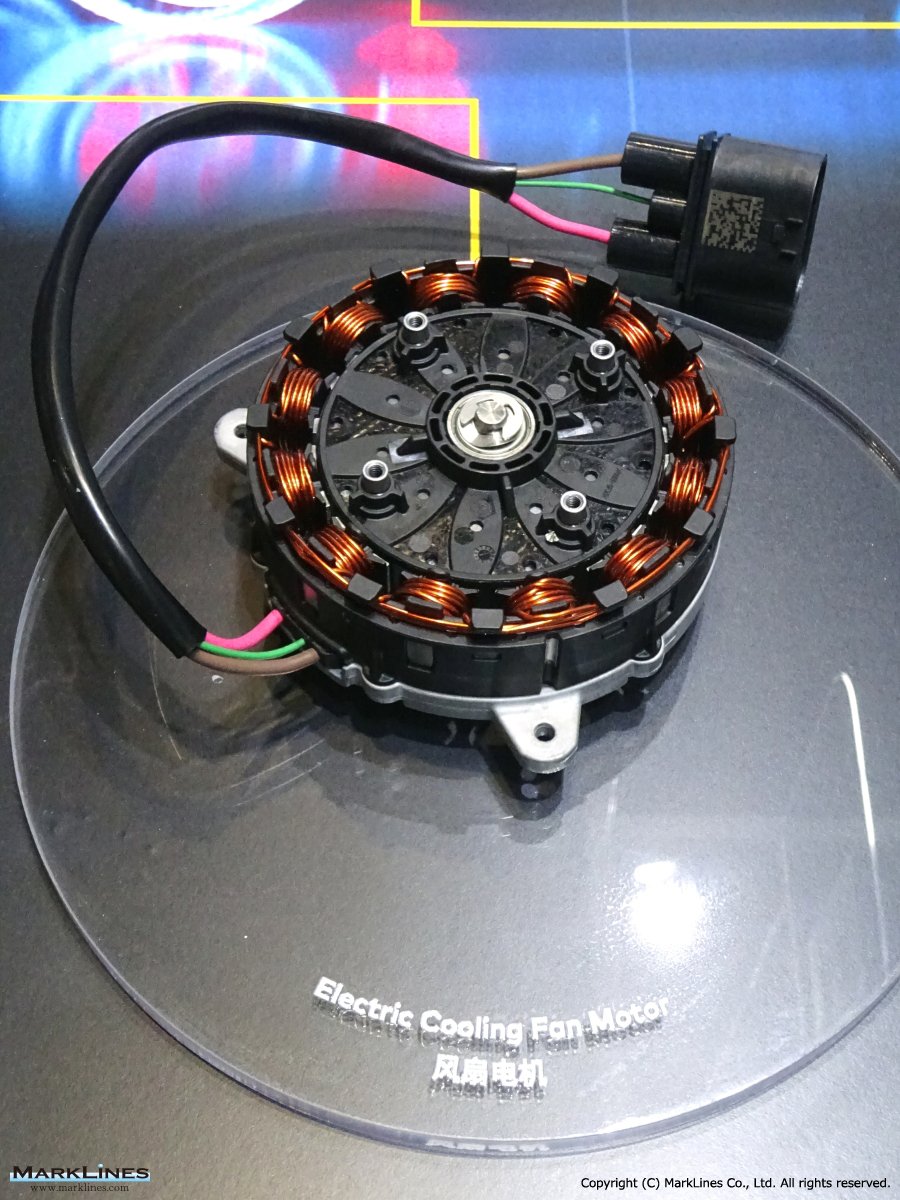
Electric Cooling Fan Motor
 5
5
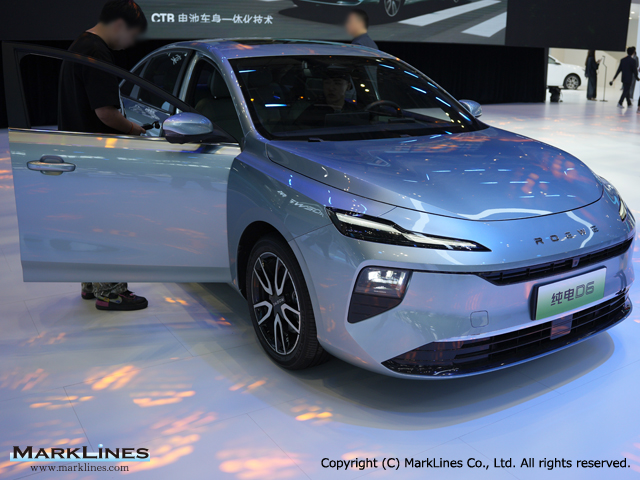
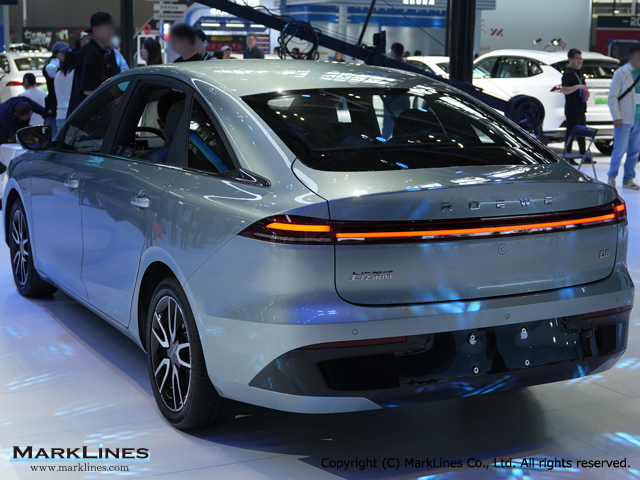
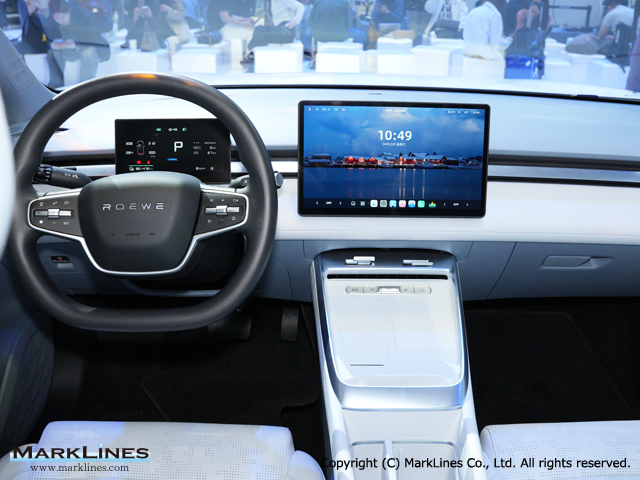
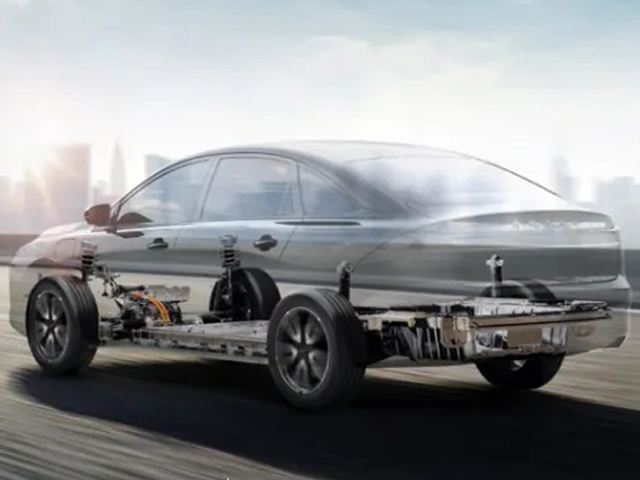
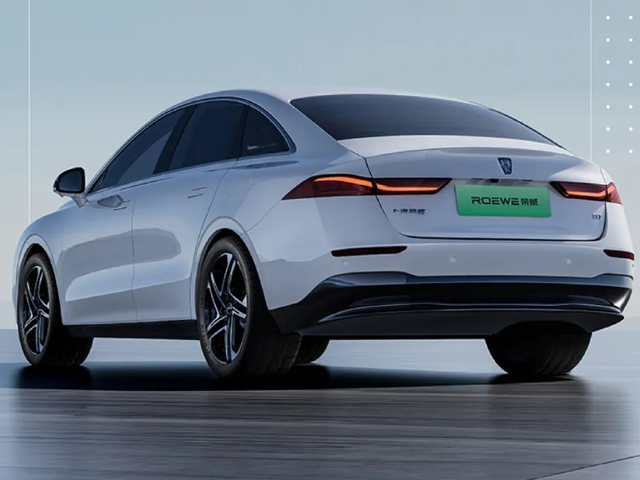
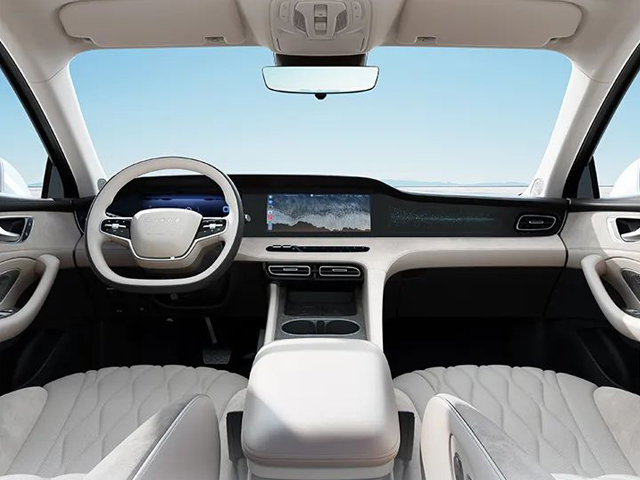
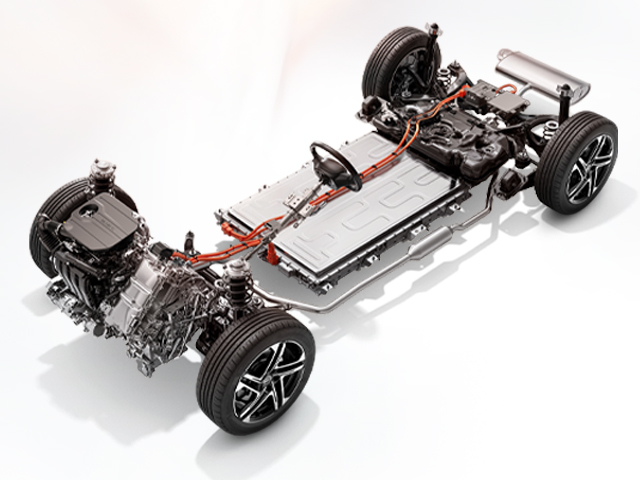
Roewe D6
 2
2
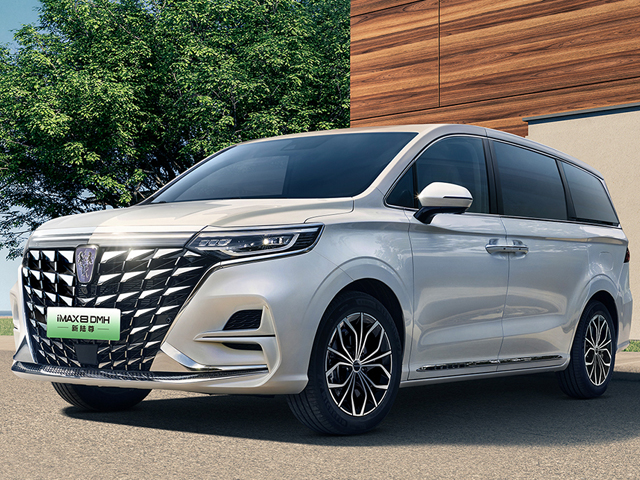
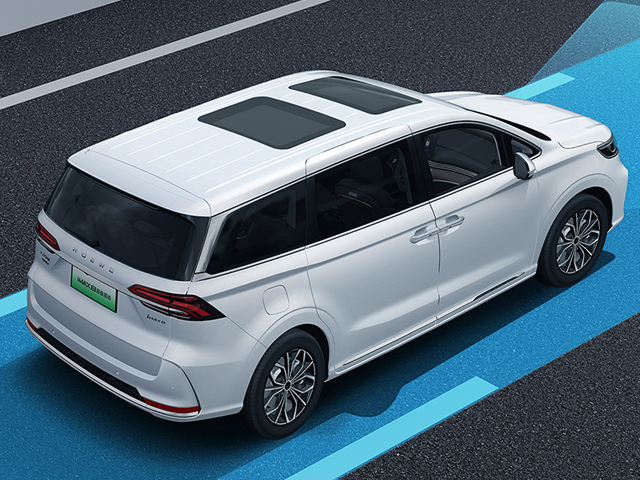
Roewe iMAX8 DMH
 3
3
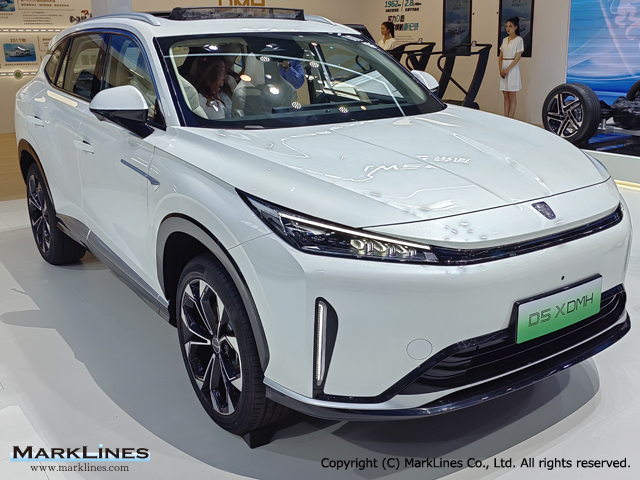
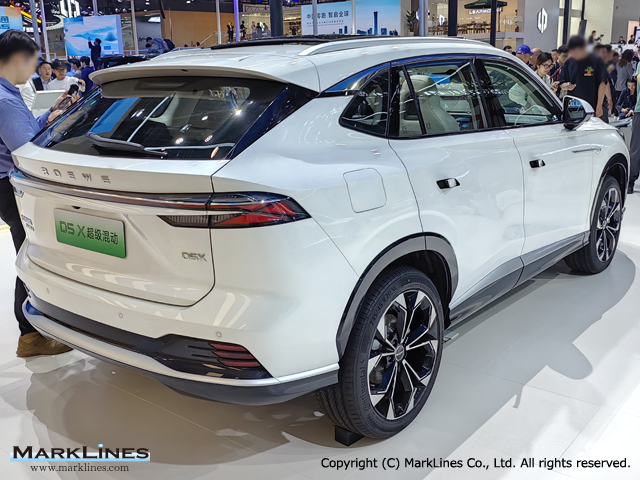
Roewe D5X DMH
 6
6
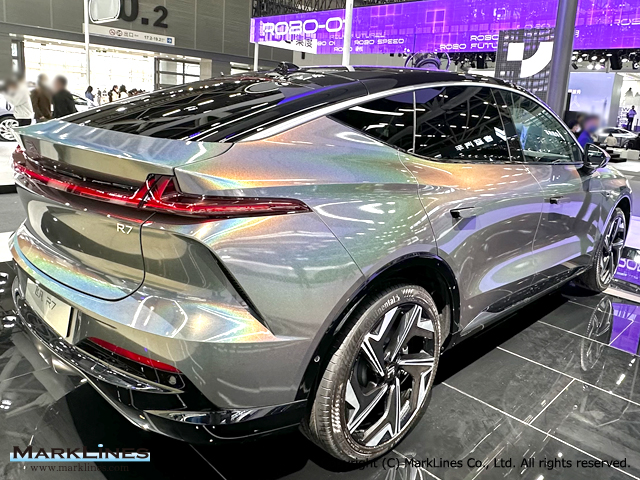
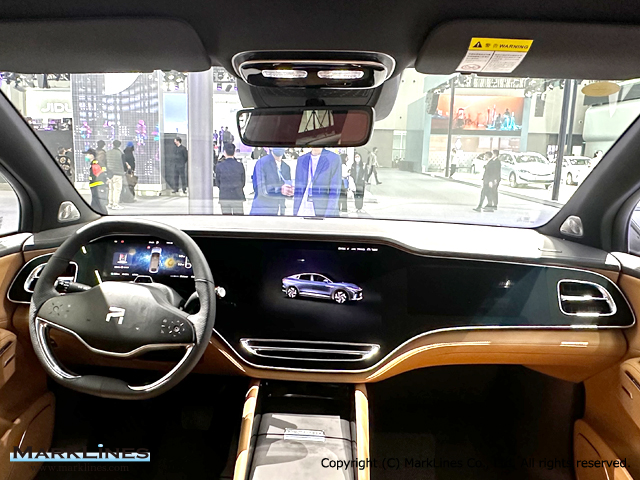
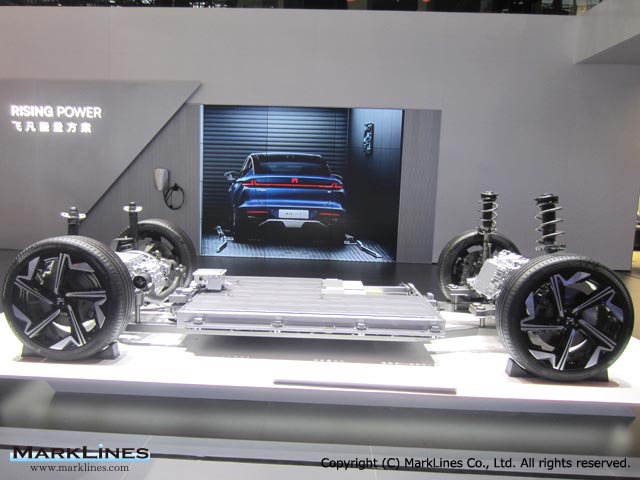
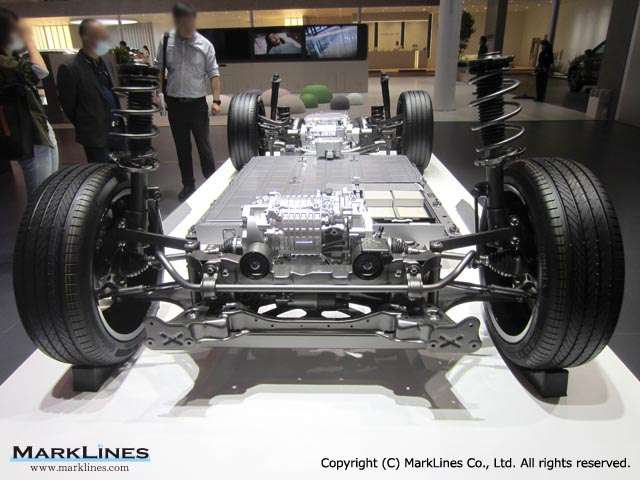
Rising R7
 4
4
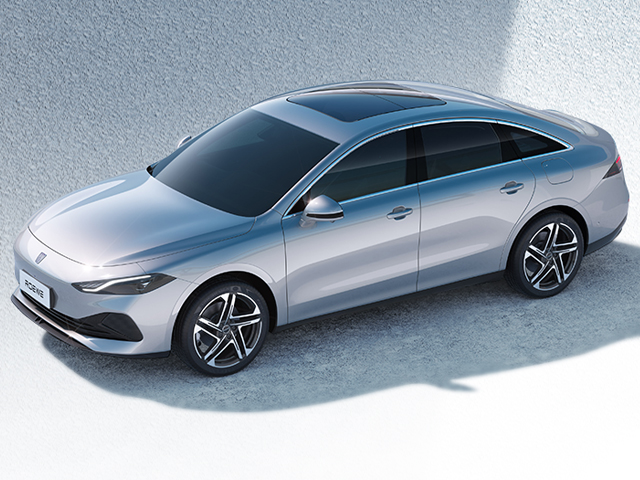
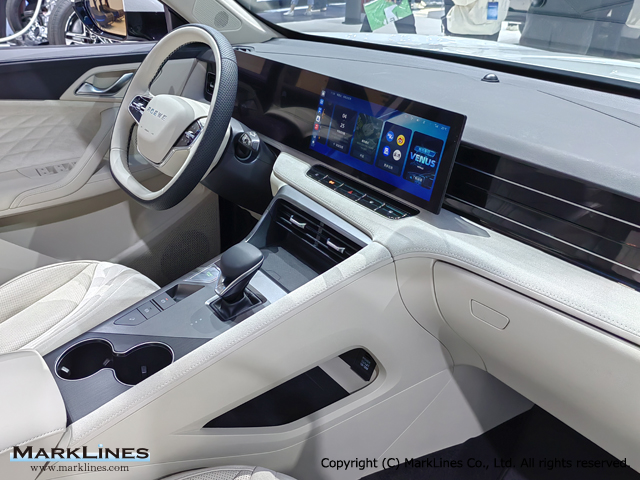
Roewe D7 DMH
Sort by :
1 - 20 of 22 results
Data changes for Sales Statistics
: List of all changes made in reverse chronological order Area/Country: Changes made for specific countries and regions Maker/Brand Dates of changes Remarks February 27, 2026 The group of some makers and brands has been changed. As a result, by-group figures will also change.- Baojun, Wuling, SAIC-GM-Wuling AutomotivePrevious Group: GM GroupNew Group: SAIC (Shanghai Automotive Industry Corporation (Group)) October 29, 2025 The "Hyundai/In...
Automotive Sales Data Updated at: 2026/05/20
Mexico - New car sales in 2026 by OEM, vehicle type
ional de Estadistica y Geografia (INEGI) reported sales of 118,859 light vehicles in April, representing an increase of 8.6% from the 109,420 sales in April 2025.Nissan led the market as the best-selling brand with 19,230 units delivered in April, an increase of 0.1% from the previous year. General Motors ranked second with 15,807 units, posting an increase of 6.0%, followed by Volkswagen Group with 12,950 units, up 5.0%; Toyota sold 10,713 units...
Automotive Sales Data Updated at: 2026/05/12
Israel - New car sales in 2026 by OEM
31 14.7% -39.5% 11,392 10.0% 15,351 13.2% -25.8% Kia 1,274 6.6% 1,348 7.3% -5.5% 10,019 8.8% 9,796 8.5% 2.3% Skoda 1,010 5.3% 1,100 5.9% -8.2% 8,056 7.1% 9,272 8.0% -13.1% Geely 689 3.6% 191 1.0% 260.7% 2,089 1.8% 1,042 0.9% 100.5% SEAT 642 3.3% 422 2.3% 52.1% 1,306 1.1% 3,600 3.1% -63.7% SAIC/MG 394 2.0% 854 4.6% -53.9% 3,117 2.7% 3,809 3.3% -18.2% Xpeng 344 1.8% 485 2.6% -29.1% 1,794 1.6% 2,705 2.3% -33.7% Mitsubishi 287 1.5% 444 ...
Automotive Sales Data Updated at: 2026/05/07
China - New car sales in 2025 by OEM, model, vehicle type
volume.This is due to the difference in calculation methods. Passenger Car retail sales by Chinese Makers Top10 - Maker Dec. 2025 (10,000) Y-o-Y 1 BYD Auto 34.0 -15.7% 2 Geely Automobile 19.7 5.9% 3 FAW-VW 14.3 -10.8% 4 Chery Automobile 12.0 -40.6% 5 Changan Automobile 11.0 -30.3% 6 SAIC VW 9.7 -35.9% 7 Tesla 9.4 13.2% 8 Harmony Intelligent Mobility Alliance 9.0 81.1% 9 SAIC-GM-Wuling 8.2 -36.5% 10 FAW Toyota 7.5 -22.2% ...
Automotive Sales Data Updated at: 2026/02/10
Israel - New car sales in 2025 by OEM
Hyundai 140 1.4% 30,306 10.4% 27,880 10.3% 8.7% Chery 1,741 17.7% 27,343 9.4% 12,945 4.8% 111.2% Kia 375 3.8% 24,067 8.3% 25,543 9.5% -5.8% Skoda 277 2.8% 20,727 7.1% 19,069 7.1% 8.7% Omoda/Jaecoo 218 2.2% 16,218 5.6% 1,358 0.5% 1094.3% BYD Auto 288 2.9% 12,982 4.5% 16,698 6.2% -22.3% SAIC/MG 76 0.8% 8,473 2.9% 6,613 2.4% 28.1% Mazda 25 0.3% 8,181 2.8% 13,715 5.1% -40.3% SEAT 91 0.9% 6,811 2.3% 8,729 3.2% -22.0% Nissan 276 2.8...
Automotive Sales Data Updated at: 2026/02/05
Israel - New car sales in 2024 by OEM
15,145 5.7% 10.3% Mazda 157 1.2% 13,715 5.1% 13,778 5.1% -0.5% Chery 731 5.7% 12,945 4.8% 11,162 4.2% 16.0% Mitsubishi 173 1.4% 10,572 3.9% 10,299 3.8% 2.7% Suzuki 869 6.8% 9,256 3.4% 8,851 3.3% 4.6% SEAT 8 0.1% 8,729 3.2% 5,647 2.1% 54.6% Tesla 1,941 15.3% 8,202 3.0% 6,767 2.5% 21.2% SAIC/MG 123 1.0% 6,613 2.4% 5,412 2.0% 22.2% Citroen 169 1.3% 5,081 1.9% 6,501 2.4% -21.8% VW 148 1.2% 4,889 1.8% 4,224 1.6% 15.7% Xpeng 1,245 9...
Automotive Sales Data Updated at: 2025/07/02
China - New car sales in 2024 by OEM, model, vehicle type
volume. This is due to the difference in calculation methods. Passenger Car retail sales by Chinese Makers Top10 - Maker Dec. 2024 (10,000) Y-o-Y 1 BYD Auto 40.3 34.3% 2 Chery Automobile 19.9 77.3% 3 Geely Automobile 18.6 46.9% 4 FAW-VW 16.1 -24.8% 5 Changan Automobile 15.7 25.0% 6 SAIC VW 15.1 2.8% 7 SAIC-GM-Wuling 12.8 22.2% 8 FAW Toyota 9.7 13.2% 9 Great Wall 8.6 22.3% 10 Tesla 8.3 9.4% Source: CPCA Three Japanese ...
Automotive Sales Data Updated at: 2025/07/02
Israel - Flash report, Automotive sales volume, 2023
0,299 3.8% 11,690 4.4% -11.9% Suzuki 207 4.4% 8,851 3.3% 8,683 3.3% 1.9% Geely 245 5.2% 7,129 2.7% 6,816 2.6% 4.6% Peugeot 67 1.4% 6,844 2.6% 5,642 2.1% 21.3% Tesla 433 9.2% 6,767 2.5% 6,047 2.3% 11.9% Citroen 82 1.7% 6,501 2.4% 7,995 3.0% -18.7% SEAT 9 0.2% 5,647 2.1% 5,555 2.1% 1.7% SAIC/MG 220 4.7% 5,412 2.0% 5,081 1.9% 6.5% Subaru 88 1.9% 4,481 1.7% 4,363 1.6% 2.7% Renault 64 1.4% 4,474 1.7% 3,576 1.4% 25.1% VW 121 2.6% 4,...
Automotive Sales Data Updated at: 2025/06/04
China - Flash report, Automotive sales volume, 2023
s volume by make (shipped from the local plant) to be released later on our data for monthly sales volume.This is due to the difference in calculation methods. Passenger Car retail sales by Chinese Makers Top10 - Maker Dec. 2023 (10,000) Y-o-Y 1 BYD Auto 30.0 34.2% 2 FAW-VW 21.3 18.3% 3 SAIC VW 14.7 2.2% 4 Geely Automobile 12.9 2.1% 5 Changan Automobile 12.4 -26.8% 6 Chery Automobile 11.2 36.6% 7 SAIC-GM-Wuling 10.5 16.0% 8 ...
Automotive Sales Data Updated at: 2025/06/04
Israel - Flash report, Automotive sales volume, 2022
12,836 4.5% -8.9% Suzuki 993 8.8% 8,683 3.3% 10,565 3.7% -17.8% Citroen 333 2.9% 7,995 3.0% 7,061 2.5% 13.2% Geely 774 6.8% 6,816 2.6% 163 0.1% 4081.6% Tesla 1,118 9.9% 6,047 2.3% 6,299 2.2% -4.0% Peugeot 73 0.6% 5,642 2.1% 7,577 2.6% -25.5% SEAT 137 1.2% 5,555 2.1% 11,453 4.0% -51.5% SAIC/MG 86 0.8% 5,081 1.9% 2,955 1.0% 71.9% Chevrolet 40 0.4% 4,721 1.8% 8,265 2.9% -42.9% Subaru 103 0.9% 4,363 1.6% 5,496 1.9% -20.6% Mercedes...
Automotive Sales Data Updated at: 2025/06/04
China - Flash report, Automotive sales volume, 2022
local plant) to be released later on our data for monthly sales volume This is due to the difference in calculation methods. Passenger Car retail sales by Chinese Makers Top10 - Maker Dec. 2022 (10,000) Y-o-Y 1 BYD Auto 22.4 128.6% 2 FAW-VW 18.0 15.5% 3 Changan Automobile 16.9 130.0% 4 SAIC VW 14.4 2.4% 5 Geely Automobile 12.6 -10.7% 6 SAIC GM 11.1 7.7% 7 FAW Toyota 10.2 -3.5% 8 GAC Toyota 10.0 0.2% 9 SAIC-GM-Wuling 9.1 -31...
Automotive Sales Data Updated at: 2025/06/04
Israel - Flash report, Automotive sales volume, 2021
225 3.7% 7,061 2.4% 5,901 2.8% 19.7% Tesla 950 15.5% 6,299 2.2% 0 0.0% -% Subaru 49 0.8% 5,495 1.9% 3,763 1.8% 46.0% VW 12 0.2% 4,392 1.5% 4,464 2.1% -1.6% Audi 3 0.0% 3,763 1.3% 3,180 1.5% 18.3% Mercedes-Benz 15 0.2% 3,609 1.2% 2,957 1.4% 22.0% BMW 3 0.0% 3,484 1.2% 2,047 1.0% 70.2% SAIC/MG 232 3.8% 3,111 1.1% 1,494 0.7% 108.2% Honda 28 0.5% 3,066 1.1% 2,542 1.2% 20.6% Jeep * 5 0.1% 2,517 0.9% 1,300 0.6% 93.6% Volvo 62 1.0% ...
Automotive Sales Data Updated at: 2025/06/04
China - Flash report, Automotive sales volume, 2021
by make (shipped from the local plant) to be released later on our data for monthly sales volume.This is due to the difference in calculation methods. Passenger Car retail sales by Chinese Makers Top10 - Maker Dec. 2021 (10,000) Y-o-Y 1 FAW-VW 15.6 -34.9% 2 Geely Automobile 14.2 -0.5% 3 SAIC VW 14.1 -13.3% 4 SAIC-GM-Wuling 13.3 -12.7% 5 Great Wall 12.5 2.5% 6 Dongfeng Nissan 11.4 -20.9% 7 FAW Toyota 10.6 27.3% 8 SAIC GM 10.3...
Automotive Sales Data Updated at: 2025/06/04
Israel - Flash report, Sales volume, 2020
63 1.8% 4,515 1.8% -16.7% Audi 6 0.1% 3,180 1.5% 3,827 1.5% -16.9% Mercedes-Benz 27 0.6% 2,957 1.4% 3,115 1.2% -5.1% Honda 62 1.4% 2,542 1.2% 5,206 2.1% -51.2% Dacia 123 2.8% 2,052 1.0% 3,162 1.2% -35.1% BMW 8 0.2% 2,047 1.0% 2,958 1.2% -30.8% Volvo 58 1.3% 1,739 0.8% 1,743 0.7% -0.2% SAIC/MG 90 2.0% 1,494 0.7% 1,112 0.4% 34.4% Lexus 66 1.5% 1,482 0.7% 1,618 0.6% -8.4% Jeep * 10 0.2% 1,300 0.6% 1,329 0.5% -2.2% Opel 64 1.4% 1,...
Automotive Sales Data Updated at: 2025/06/04
China - Flash report, Sales volume, 2020
may differ from the sales volume by make (shipped from the local plant) to be released later on our data for monthly sales volume. This is due to the difference in calculation methods. Passenger Car retail sales by Chinese Makers Top10 - Maker Dec. 2020 (10,000) Y-o-Y 1 FAW-VW 24.0 5.3% 2 SAIC GM 16.2 30.3% 3 SAIC VW 16.2 -26.7% 4 SAIC-GM-Wuling 15.2 9.6% 5 Dongfeng Nissan 14.4 0.5% 6 Geely Automobile 14.2 12.3% 7 Great Wall 1...
Automotive Sales Data Updated at: 2025/06/04
Israel - Flash report, Sales volume, 2019
77 3.2% 2,958 1.2% 3,312 1.2% -10.7% Volvo 36 0.6% 1,743 0.7% 1,628 0.6% 7.1% Lexus 61 1.1% 1,618 0.6% 1,515 0.6% 6.8% Isuzu 21 0.4% 1,518 0.6% 1,384 0.5% 9.7% Fiat 76 1.4% 1,493 0.6% 2,864 1.1% -47.9% Jeep * 26 0.5% 1,329 0.5% 1,011 0.4% 31.5% Opel 6 0.1% 1,151 0.5% 3,060 1.1% -62.4% SAIC/MG 15 0.3% 1,112 0.4% 515 0.2% 115.9% Ford 15 0.3% 1,071 0.4% 1,701 0.6% -37.0% MINI 29 0.5% 553 0.2% 561 0.2% -1.4% Land Rover 33 0.6% 485...
Automotive Sales Data Updated at: 2020/03/13
Israel - Flash report, Sales volume, 2018
vo 40 0.8% 1,628 0.6% 1,284 0.5% 26.8% Lexus 62 1.2% 1,515 0.6% 1,227 0.4% 23.5% Isuzu 30 0.6% 1,384 0.5% 1,597 0.6% -13.3% Jeep * 48 0.9% 1,011 0.4% 977 0.3% 3.5% Alfa Romeo 57 1.1% 635 0.2% 718 0.3% -11.6% MINI 9 0.2% 561 0.2% 659 0.2% -14.9% Infiniti 64 1.3% 558 0.2% 414 0.1% 34.8% SAIC/MG 15 0.3% 515 0.2% 257 0.1% 100.4% Cadillac 0 0.0% 461 0.2% 525 0.2% -12.2% Ssangyong 11 0.2% 385 0.1% 305 0.1% 26.2% Land Rover 8 0.2% 31...
Automotive Sales Data Updated at: 2019/01/07
Israel - Flash report, Sales volume, 2017
Jeep * 61 1.1% 977 0.3% 744 0.3% 31.3% Alfa Romeo 19 0.3% 718 0.3% 510 0.2% 40.8% MINI 22 0.4% 659 0.2% 658 0.2% 0.2% Cadillac 3 0.1% 525 0.2% 285 0.1% 84.2% Infiniti 7 0.1% 414 0.1% 348 0.1% 19.0% Ssangyong 4 0.1% 305 0.1% 435 0.2% -29.9% Land Rover 10 0.2% 294 0.1% 339 0.1% -13.3% SAIC/MG 0 0.0% 257 0.1% 289 0.1% -11.1% Porsche 0 0.0% 165 0.1% 92 0.0% 79.3% Maserati 0 0.0% 121 0.0% 53 0.0% 128.3% Jaguar 1 0.0% 112 0.0% 172...
Automotive Sales Data Updated at: 2018/07/24
Israel - Flash report, Sales volume, 2016
% Volvo 26 0.4% 1,261 0.4% 1,020 0.4% 23.6% Jeep * 41 0.6% 744 0.3% 728 0.3% 2.2% MINI 46 0.7% 658 0.2% 611 0.2% 7.7% Alfa Romeo 37 0.5% 510 0.2% 522 0.2% -2.3% Ssangyong 8 0.1% 435 0.2% 225 0.1% 93.3% Infiniti 2 0.0% 348 0.1% 385 0.2% -9.6% Land Rover 7 0.1% 339 0.1% 188 0.1% 80.3% SAIC/MG 40 0.6% 289 0.1% 873 0.3% -66.9% Cadillac 14 0.2% 285 0.1% 362 0.1% -21.3% Chrysler * 22 0.3% 192 0.1% 142 0.1% 35.2% smart 2 0.0% 175 0...
Automotive Sales Data Updated at: 2017/01/06
Israel - Flash report, Sales volume, 2015
nz 22 0.2% 2,569 1.0% 1,985 0.8% 29.4% BMW 17 0.2% 2,433 1.0% 1,733 0.7% 40.4% Dacia 115 1.2% 2,422 1.0% 4 0.0% 60450.0% Ford 33 0.3% 1,955 0.8% 7,927 3.3% -75.3% Isuzu 121 1.2% 1,584 0.6% 1,584 0.7% 0.0% Lexus 20 0.2% 1,449 0.6% 1,001 0.4% 44.8% Volvo 19 0.2% 1,020 0.4% 985 0.4% 3.6% SAIC/MG 7 0.1% 873 0.3% 4 0.0% 21725.0% Jeep* 24 0.2% 728 0.3% 664 0.3% 9.6% MINI 13 0.1% 611 0.2% 496 0.2% 23.2% Alfa Romeo 24 0.2% 522 0.2% 50...
Automotive Sales Data Updated at: 2016/04/18
 Japan
Japan USA
USA Mexico
 Germany
 China (Shanghai)
 Thailand
 India
India