


Search Results by Category
All information related to {{ key_word }}.
AI Navigator will guide you. Click here for information about {{ key_word }}.
Images
 1
1
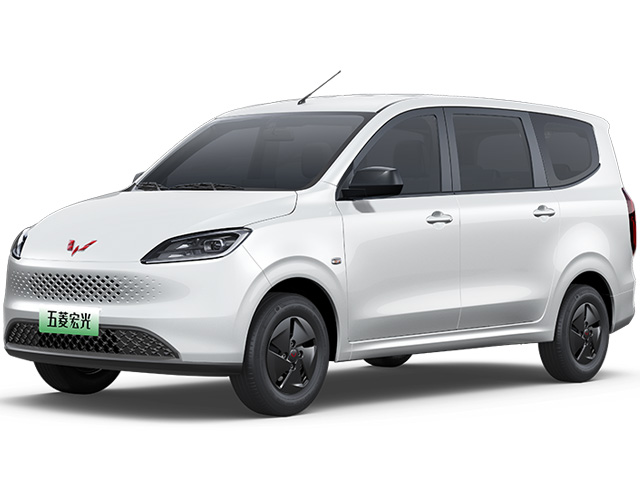
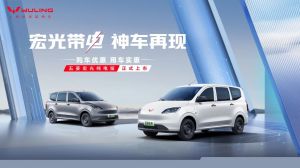
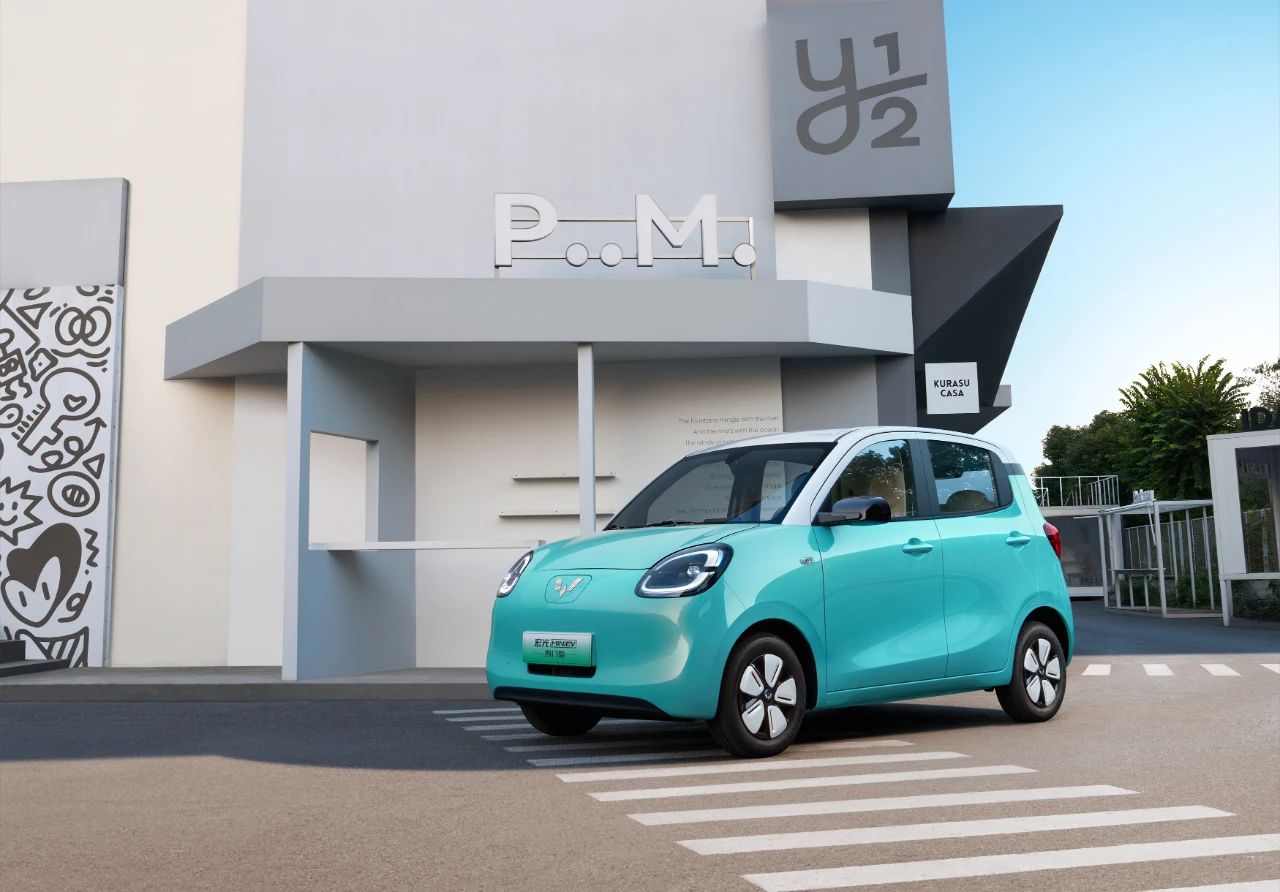
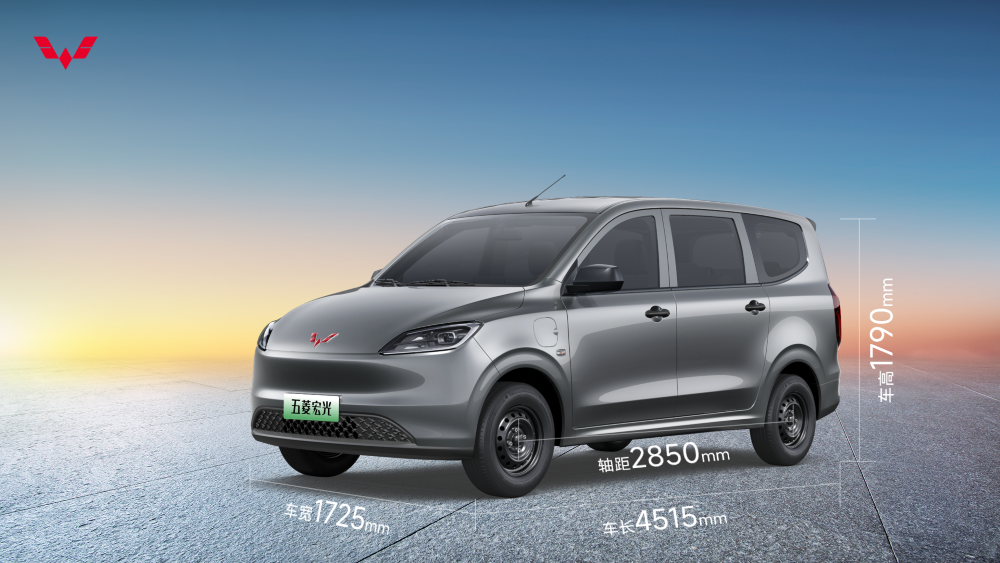
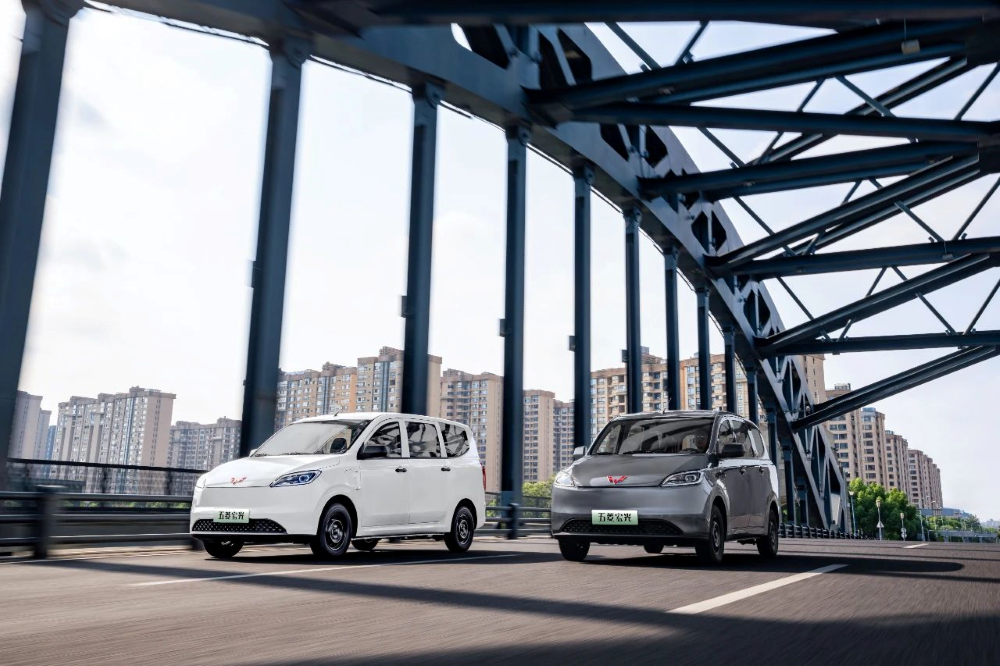
Wuling Hongguang REEV
 5
5
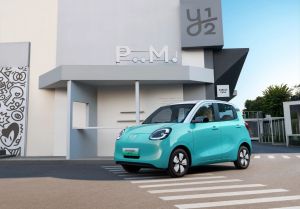
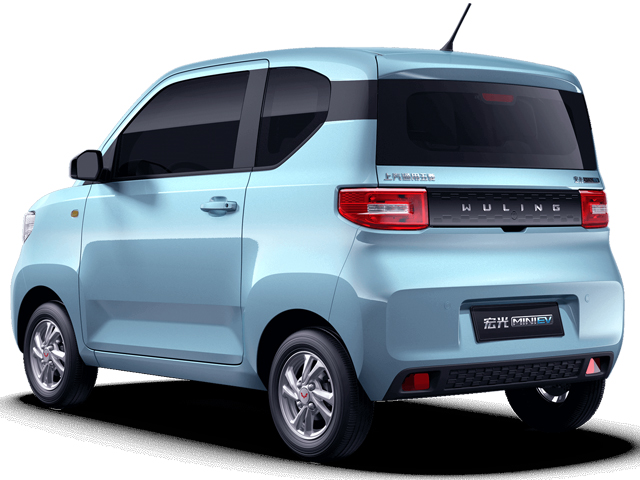
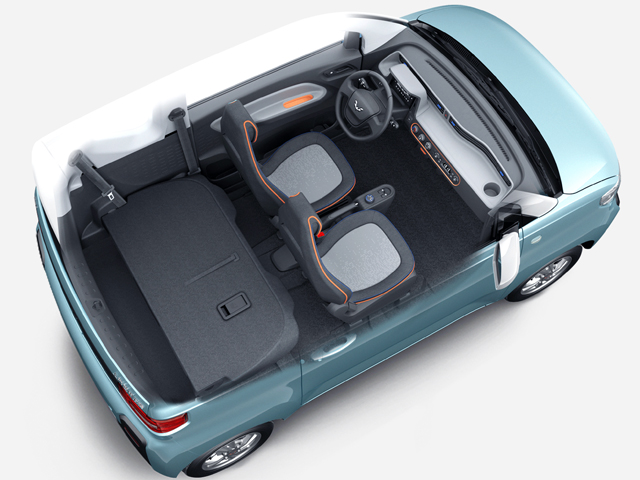
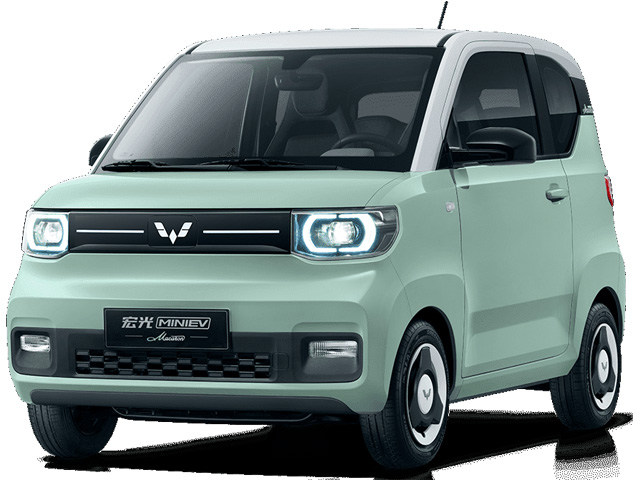
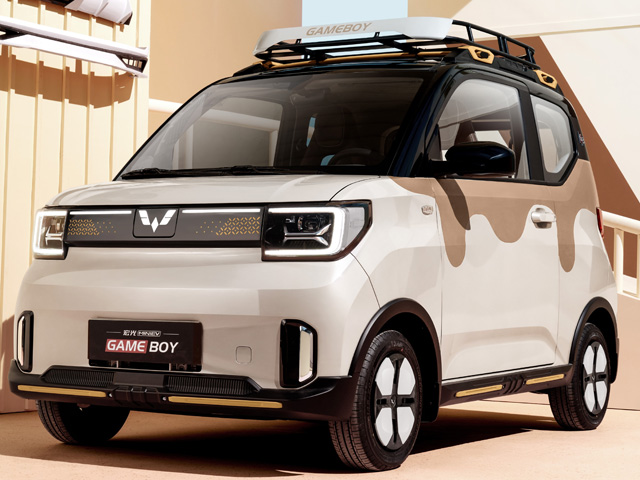
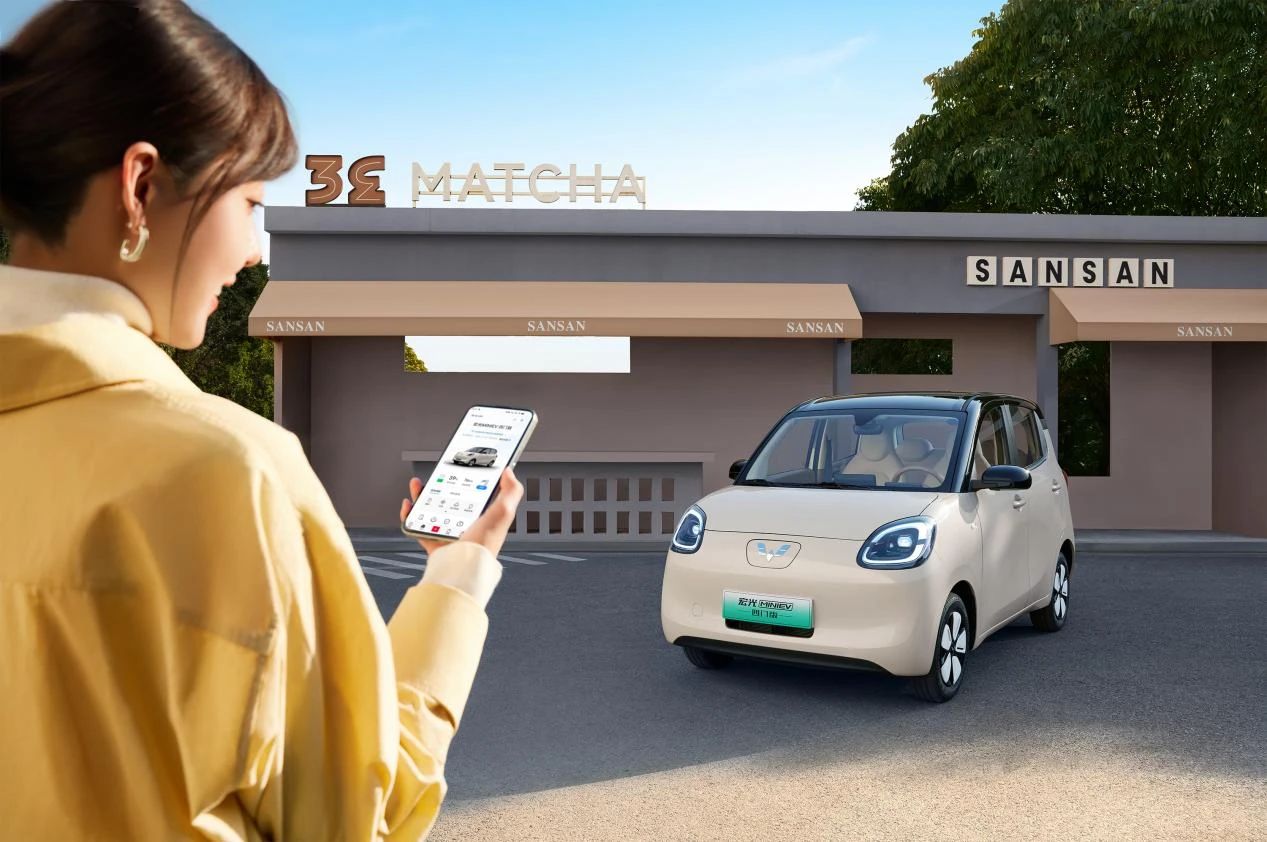
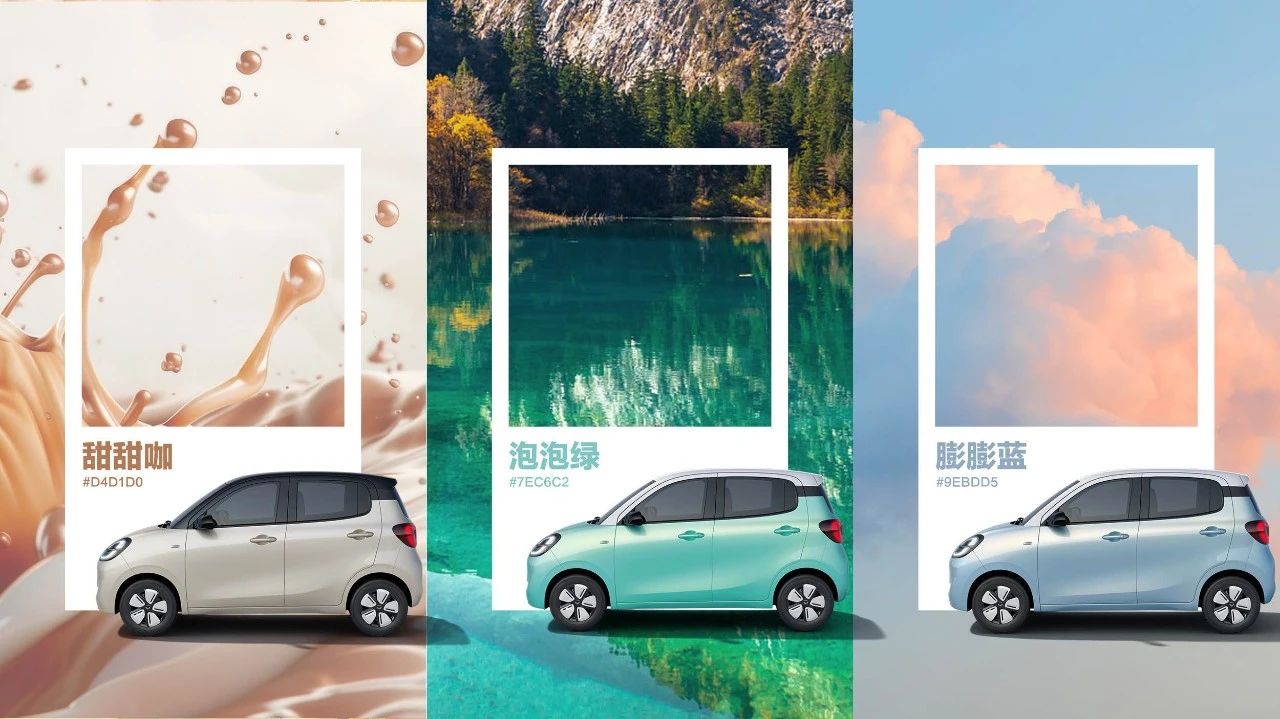
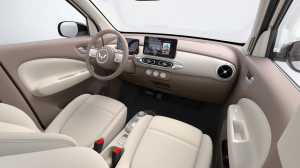
Wuling Hongguang MINI EV/Macaron/Gameboy/Convertible/4-door
 2
2
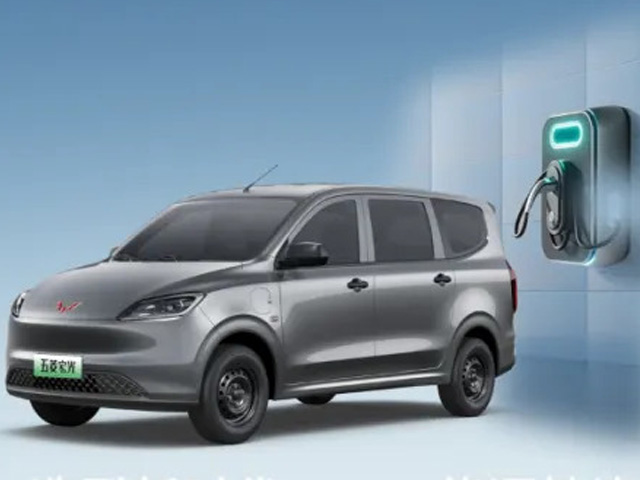
Wuling Hongguang EV
 1
1
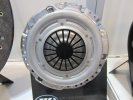
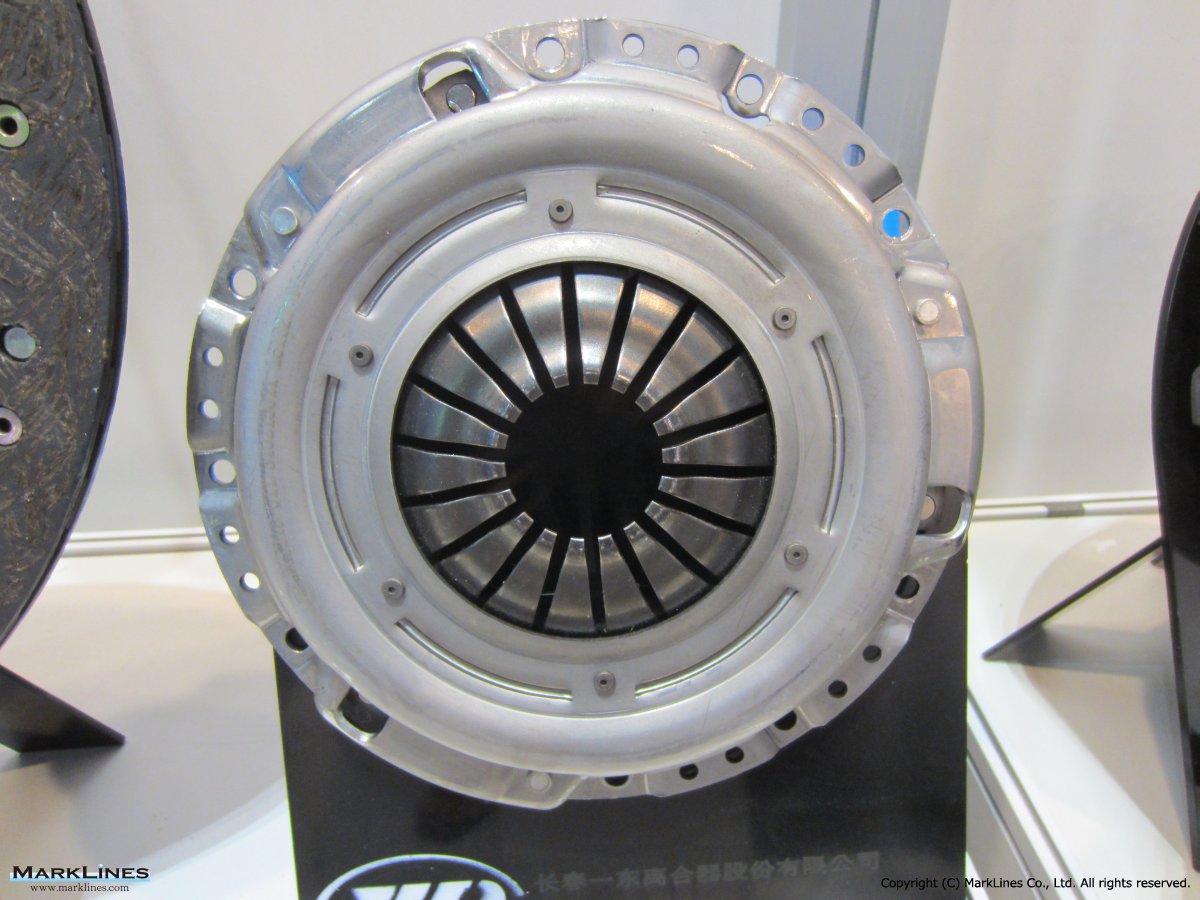
Clutch cover
 4
4
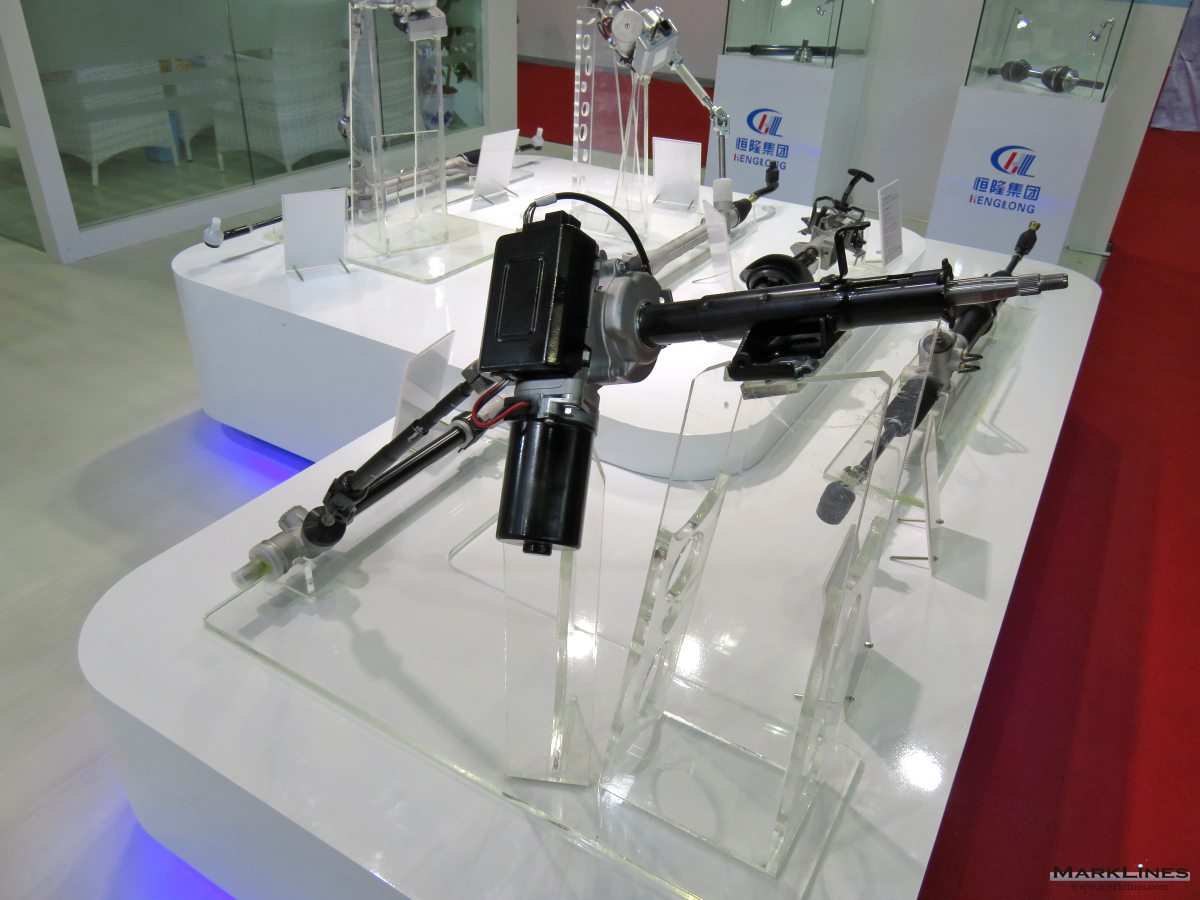
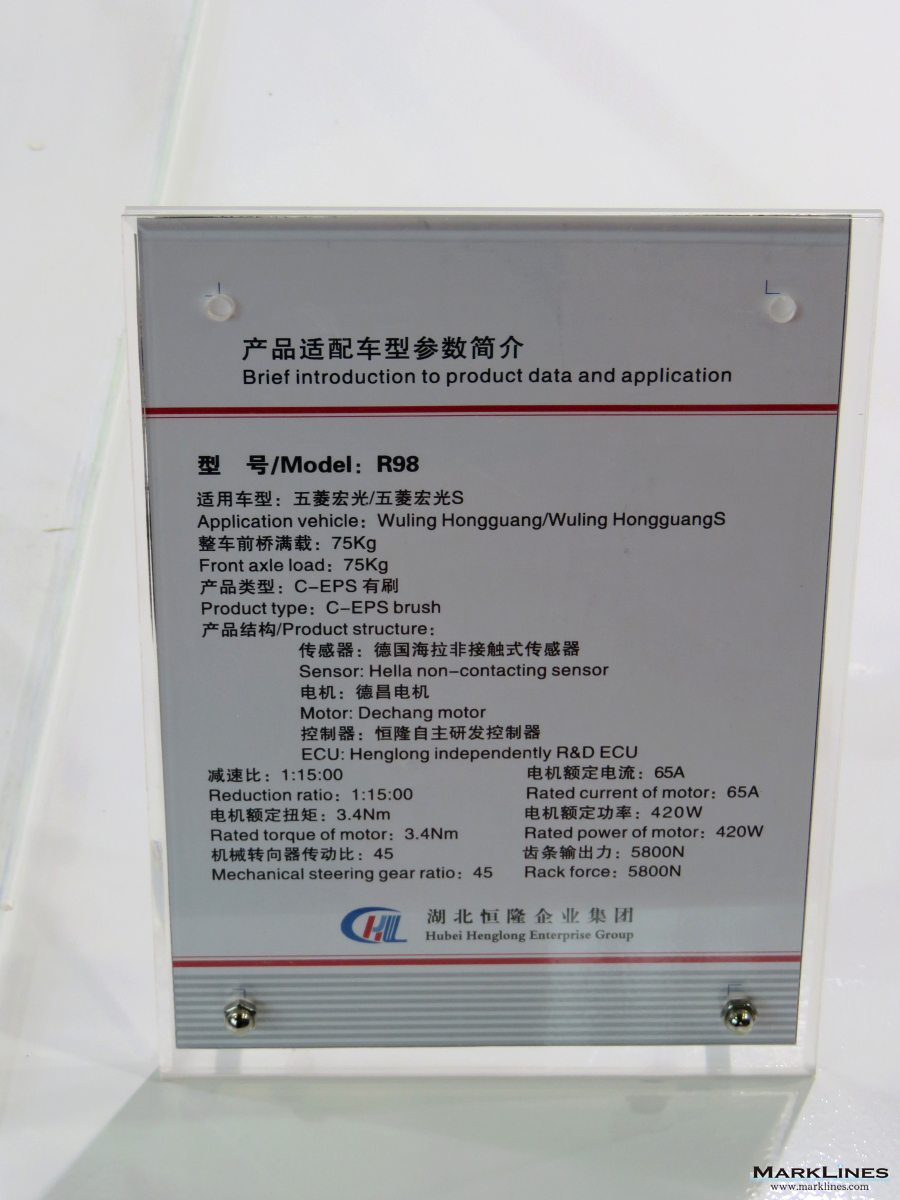
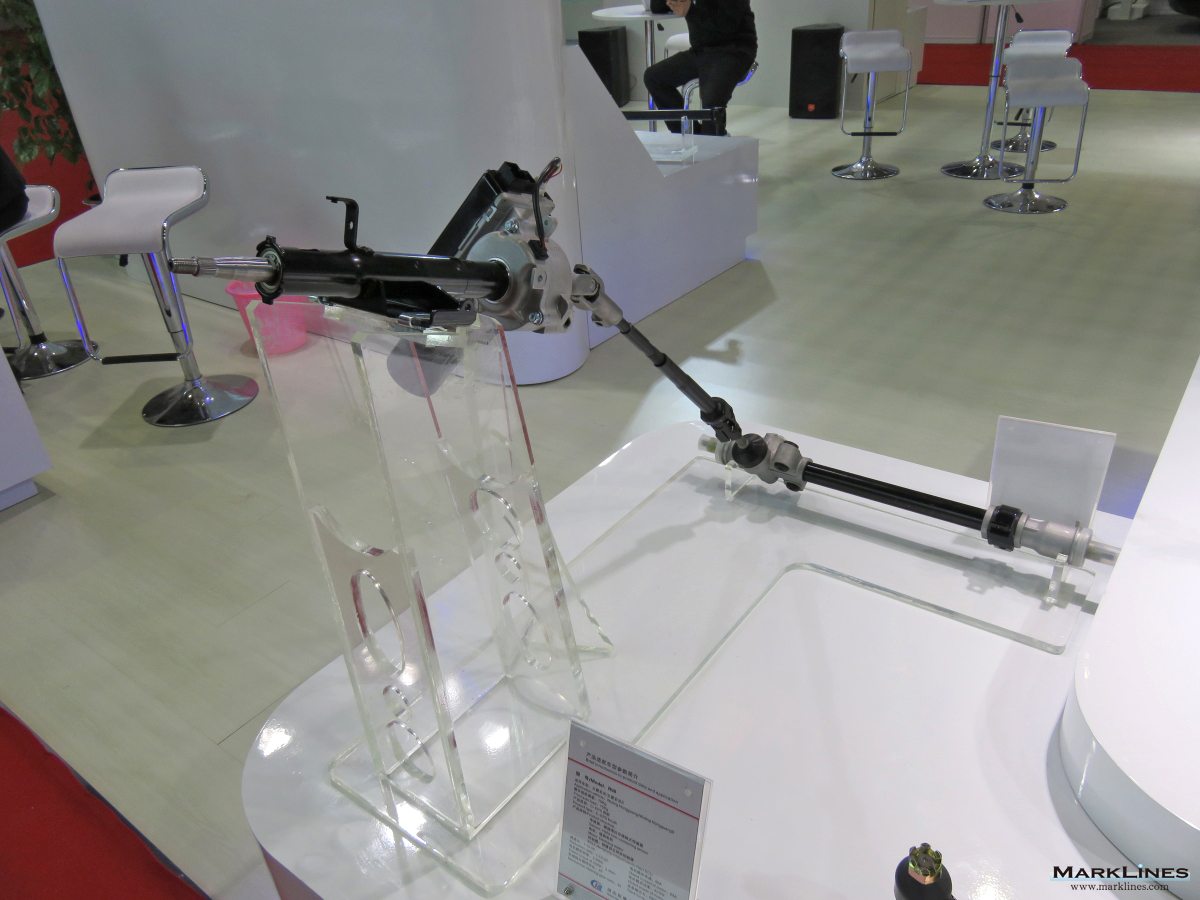
Hubei Henglong Automotive System Group Co., Ltd. Column-type electric power steering (C-EPS)
 4
4
SGMW launches Hongguang MINI EV 4-Door hatchback
 3
3
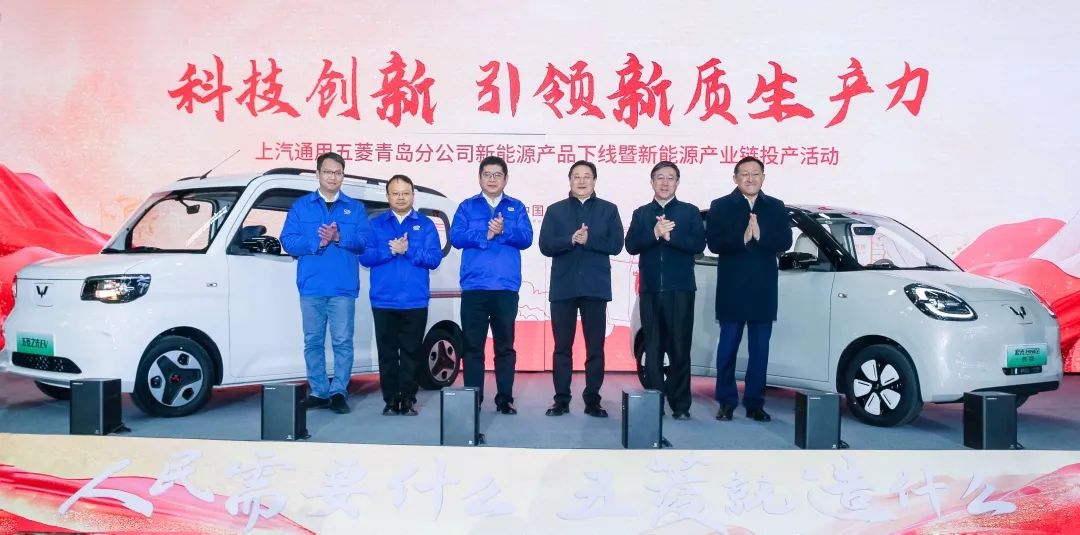
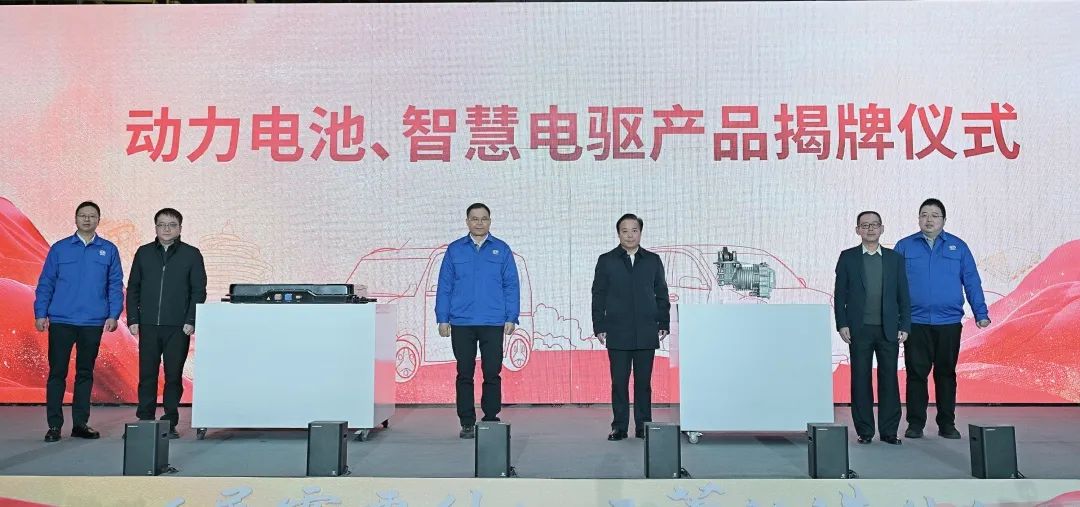
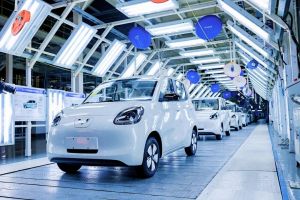
SGMW Qingdao branch kicks off production of New Energy Vehicles, marking commencement of new energy industry chain
 4
4
Wuling Motors unveils Hongguang MINI EV 4-door hatchback
 1
1
SGMW launches battery electric version of Wuling Hongguang MPV
 2
2
SGMW starts accepting pre-orders for battery electric version of Wuling Hongguang MPV
Sort by :
1 - 9 of 9 results
Representative models for each segment
Representative models for each segment Home Representative models for each segment Representative models for each segment These are typical models included in each segment. (Refer to sales volume in 2025) Segment Representative models North America Europe China Japan Other Sedan/Hatchback A (Basic) Fiat 500, JAC E10X, Auteco D2S Fiat Panda, Hyundai i10, Kia Morning BYD Seagull, Wuling Hongguang MINIEV, Changan Lumin Honda N-BOX, Su...
Automotive Sales Data Updated at: 2026/03/10
China - New car sales in 2025 by OEM, model, vehicle type
t selling models - Maker/Brand Model Dec. 2025 Dec. 2024 Y-o-Y Jan.- Dec. 2025 Jan.- Dec. 2024 Y-o-Y 1 Tesla Model Y 66,189 61,984 6.8% 538,994 556,689 -3.2% 2 BYD Auto Seagull 44,627 57,087 -21.8% 529,537 479,294 10.5% 3 Geely Geely Xingyuan 41,619 16,491 152.4% 478,960 52,659 809.6% 4 Wuling Wuling Hongguang MINIEV 18,526 44,903 -58.7% 440,687 225,371 95.5% 5 BYD Auto Song PLUS 21,223 60,142 -64.7% 400,920 510,463 -21.5% 6 BYD A...
Automotive Sales Data Updated at: 2026/02/10
China - New car sales in 2024 by OEM, model, vehicle type
fference in calculation methods. Passenger Car retail sales by Chinese Makers Top10 - Maker Dec. 2024 (10,000) Y-o-Y 1 BYD Auto 40.3 34.3% 2 Chery Automobile 19.9 77.3% 3 Geely Automobile 18.6 46.9% 4 FAW-VW 16.1 -24.8% 5 Changan Automobile 15.7 25.0% 6 SAIC VW 15.1 2.8% 7 SAIC-GM-Wuling 12.8 22.2% 8 FAW Toyota 9.7 13.2% 9 Great Wall 8.6 22.3% 10 Tesla 8.3 9.4% Source: CPCA Three Japanese OEMs’ Chinese sales figures ...
Automotive Sales Data Updated at: 2025/07/02
China - Flash report, Automotive sales volume, 2022
546.7 77.5 83.4 PHV 19.4 24.4 132.4 158.8 22.5 164.1 FCV 0.1 0.13 4.1 0.4 0.06 105.4 Total 79.5 100.0 51.8 705.8 100.0 96.9 Source:CAAM, Each maker's press releasesChina - Top 10 best selling models - Maker/Brand Model Dec. 2022 Dec. 2021 Y-o-Y Jan.- Dec. 2022 Jan.- Dec. 2021 Y-o-Y 1 Wuling Wuling Hongguang MINIEV 82,340 55,742 47.7% 572,757 426,482 34.3% 2 Tesla Model Y 35,750 40,558 -11.9% 455,091 200,131 127.4% 3 BYD Auto So...
Automotive Sales Data Updated at: 2025/06/04
China - Flash report, Automotive sales volume, 2021
0.8 82.1 7.1 Commercial Vehicles Total 38.0 13.1 -25.3 467.4 17.9 -10.7 Grand Total 290.7 100.0 2.4 2,608.2 100.0 3.4 Source:CAAM, Each maker's press releasesChina - Top 10 best selling models - Maker/Brand Model Dec. 2021 Dec. 2020 Y-o-Y Jan.- Dec. 2021 Jan.- Dec. 2020 Y-o-Y 1 Wuling Wuling Hongguang MINIEV 55,742 32,097 73.7% 426,482 126,603 236.9% 2 VW Lavida 35,905 36,369 -1.3% 391,362 417,324 -6.2% 3 Haval Haval H6 4...
Automotive Sales Data Updated at: 2025/06/04
China - Flash report, Sales volume, 2020
1,295 -1.6% 332,386 334,668 -0.7% 5 VW Sagitar 27,295 31,789 -14.1% 299,839 307,323 -2.4% 6 Buick Excelle GT 42,233 26,083 61.9% 295,857 279,280 5.9% 7 Nissan Bluebird Sylphy/Sylphy 28,561 26,950 6.0% 282,960 346,551 -18.3% 8 Changan/Chana CS75 24,011 28,620 -16.1% 266,824 193,227 38.1% 9 Wuling Wuling Hongguang 39,184 53,336 -26.5% 261,914 374,878 -30.1% 10 Nissan 14th Sylphy/Sylphy 33,778 26,738 26.3% 259,765 124,255 109.1% Sourc...
Automotive Sales Data Updated at: 2025/06/04
China - Flash report, Sales volume, 2019
100.0 -7.5 Source:CAAM, Each maker's press releasesChina - Top 10 best selling models - Maker/Brand Model Dec. 2019 Dec. 2018 Y-o-Y Jan.- Dec. 2019 Jan.- Dec. 2018 Y-o-Y 1 VW Lavida 62,644 40,320 55.4% 517,192 468,792 10.3% 2 Haval Haval H6 41,706 50,303 -17.1% 386,405 452,552 -14.6% 3 Wuling Wuling Hongguang 53,336 59,673 -10.6% 374,878 476,537 -21.3% 4 Toyota Corolla/New Corolla 32,505 27,755 17.1% 357,798 376,077 -4.9% 5 Nissa...
Automotive Sales Data Updated at: 2020/05/12
China - Flash report, Sales volume, 2018
nd Total 248.22 100.00 -18.39 2,780.92 100.00 -4.16 Source:CAAM, Each maker's press releases China - Top 10 best selling models - Maker/Brand Model Dec. 2018 Dec. 2017 Y-o-Y Jan.- Dec. 2018 Jan.- Dec. 2017 Y-o-Y 1 Nissan Bluebird Sylphy/Sylphy 56,339 44,141 27.6% 481,216 405,854 18.6% 2 Wuling Wuling Hongguang 59,673 63,590 -6.2% 476,537 533,950 -10.8% 3 VW Lavida 40,320 44,703 -9.8% 468,792 457,114 2.6% 4 Haval Haval H6 50,303 55...
Automotive Sales Data Updated at: 2019/01/31
China - Flash report, Sales volume, 2017
85.49 1.58 Commercial Vehicles Total 43.18 14.20 3.11 420.87 14.51 13.81 Grand Total 304.14 100.00 -0.70 2,901.54 100.00 3.19 Source:CAAM, Each maker's press releases China - Top 10 best selling models - Maker/Brand Model Dec. 2017 Dec. 2016 Y-o-Y Jan.-Dec. 2017 Jan.-Dec. 2016 Y-o-Y 1 Wuling Wuling Hongguang 63,590 82,543 -23.0% 533,950 650,018 -17.9% 2 Haval Haval H6 55,126 80,495 -31.5% 506,362 580,683 -12.8% 3 VW Lavida 44,70...
Automotive Sales Data Updated at: 2018/07/24


 Japan
Japan USA
USA Mexico
 Germany
 China (Shanghai)
 Thailand
 India
India