


Search Results by Category
All information related to {{ key_word }}.
AI Navigator will guide you. Click here for information about {{ key_word }}.
Images
 3
3
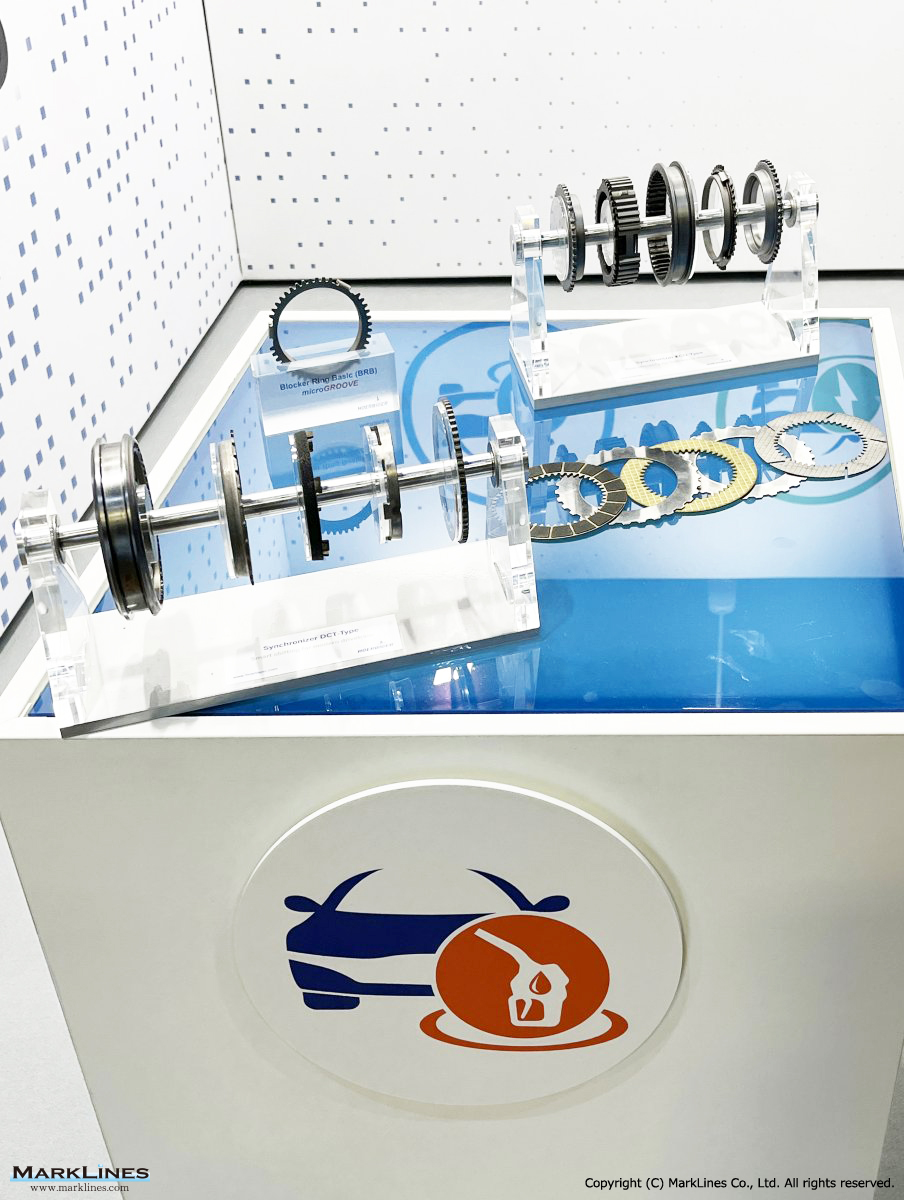
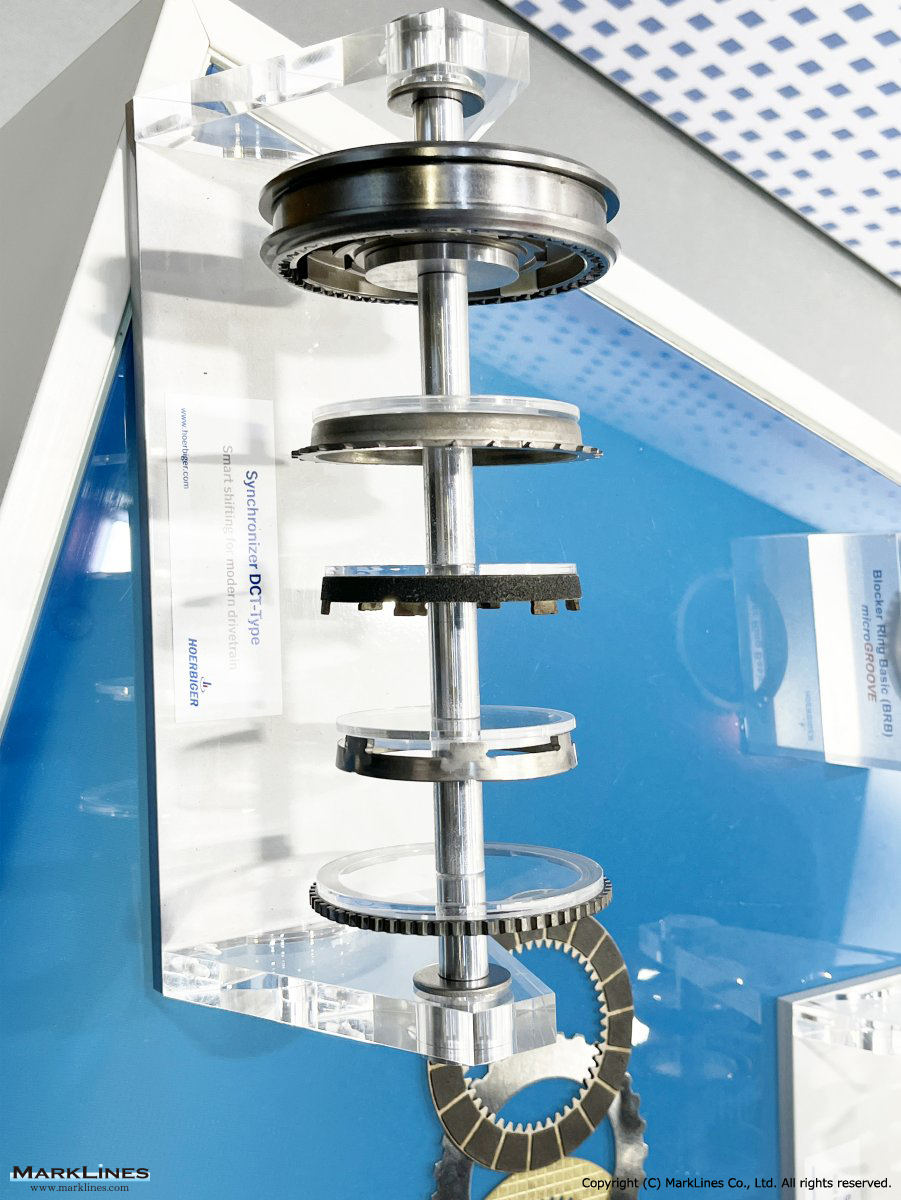
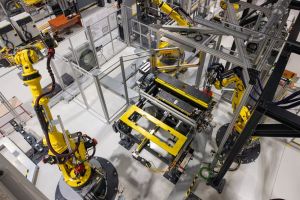
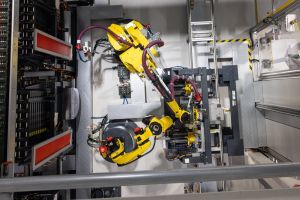
Synchronizer rings for conventional drivetrains
 2
2
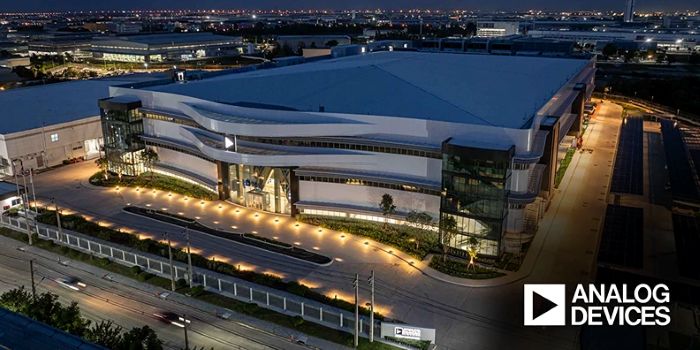
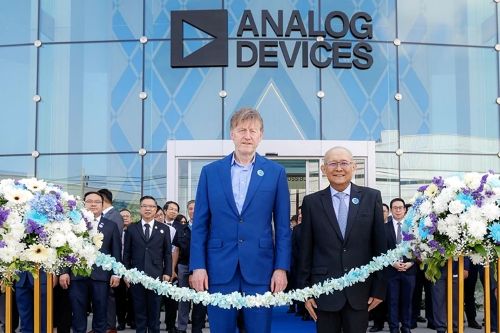
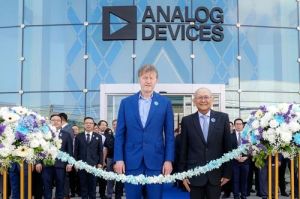
U.S.-based Analog Devices launches new semiconductor facility in Chonburi, Thailand
 3
3
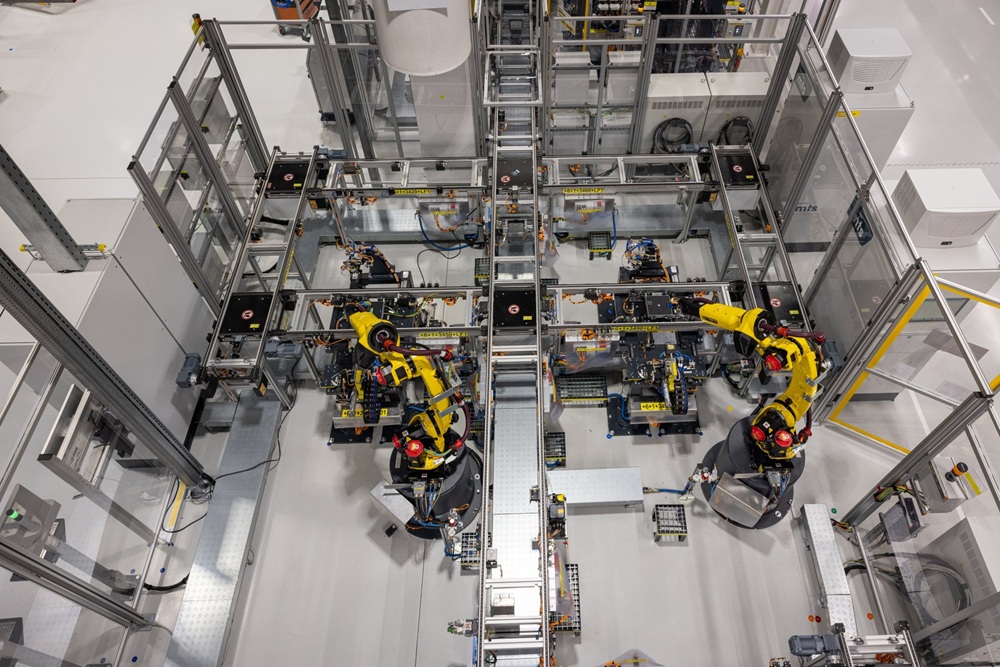
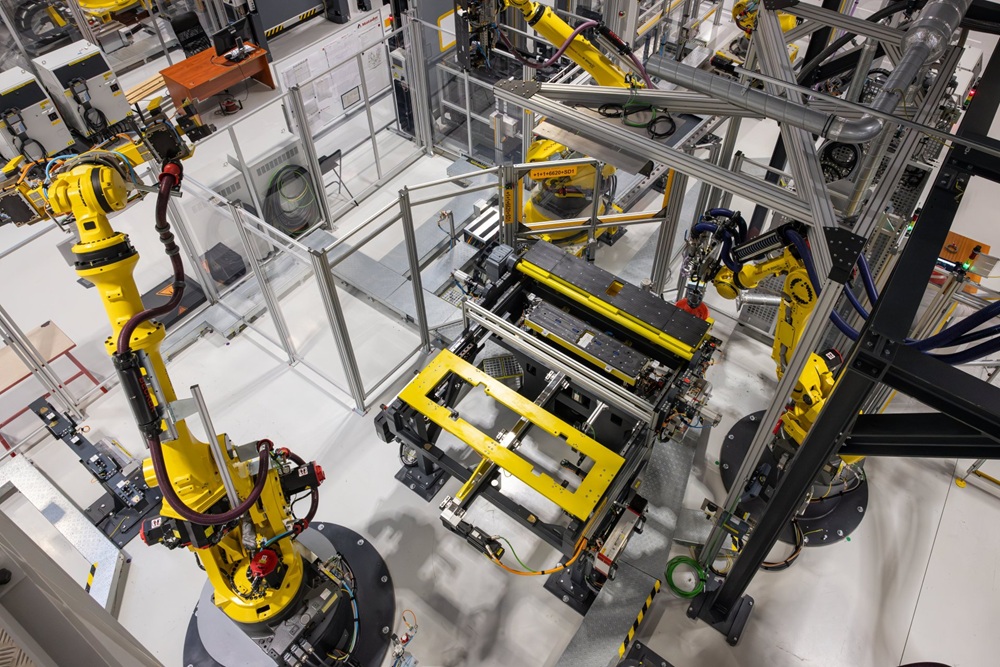
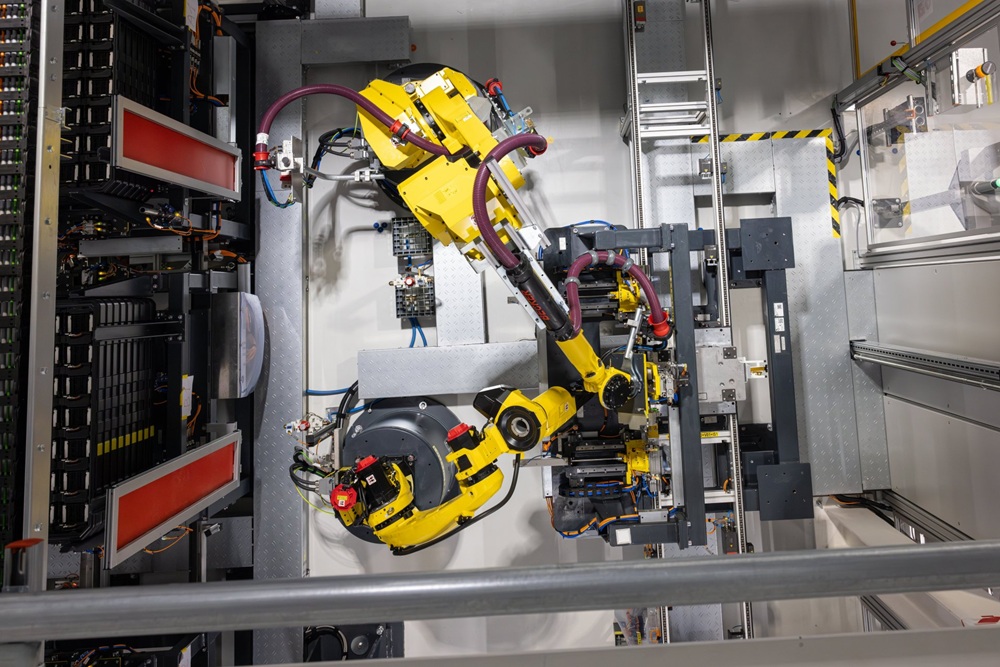
Porsche unveils high-tech battery manufacturing for next-gen Cayenne EV in Horná Streda, Slovakia
 2
2
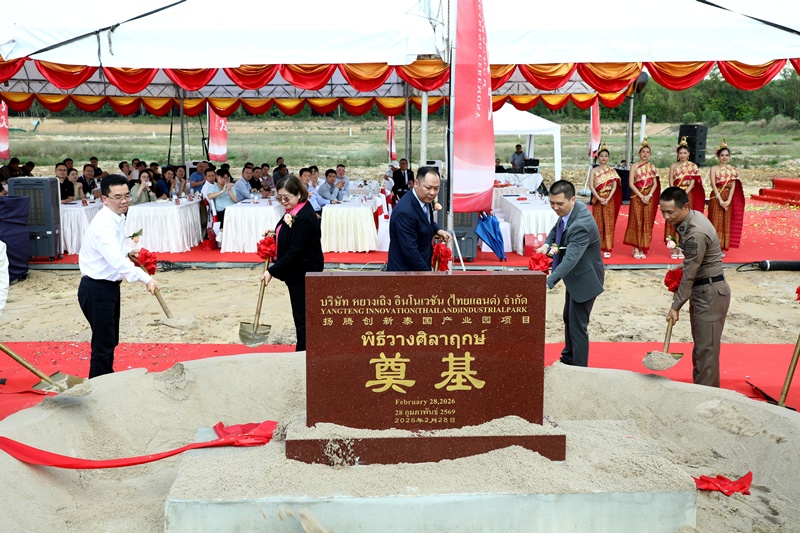
Yangteng Innovation breaks ground on automotive parts facility in Rayong, Thailand
 5
5
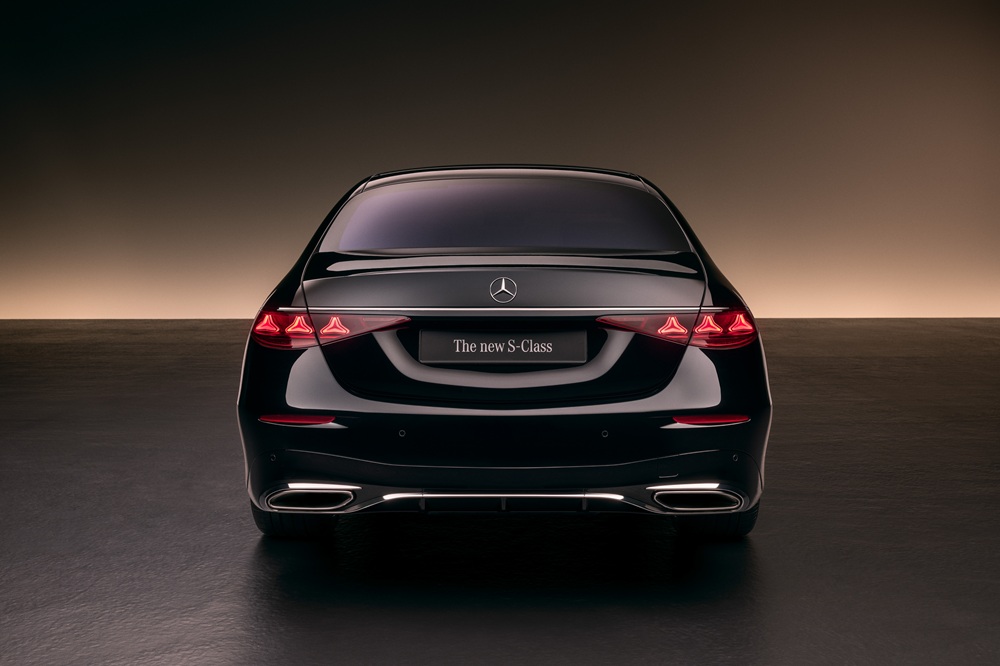
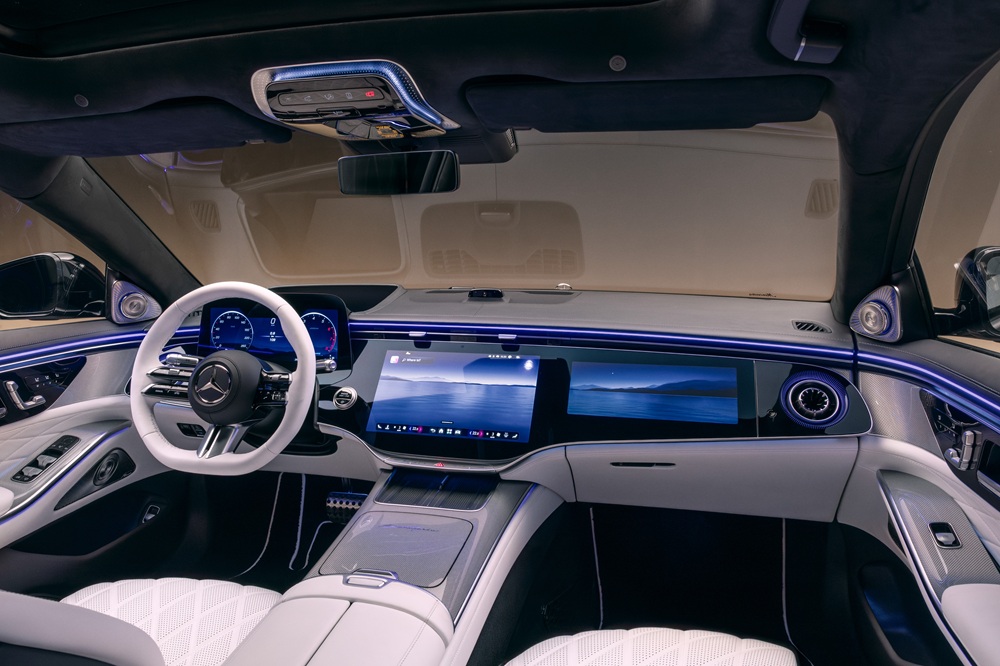
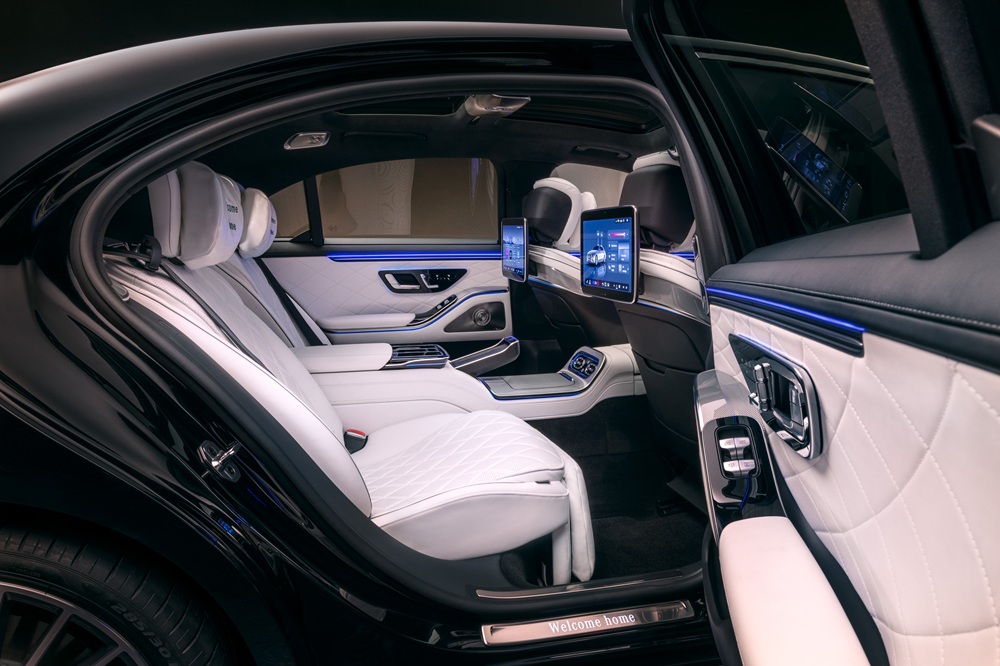
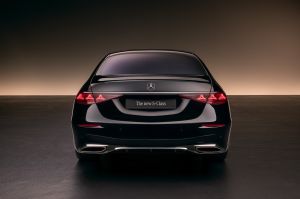
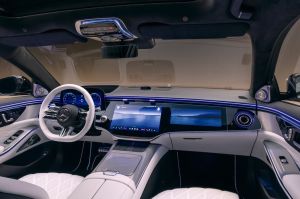
Mercedes-Benz unveils updated S-Class luxury saloon
 7
7
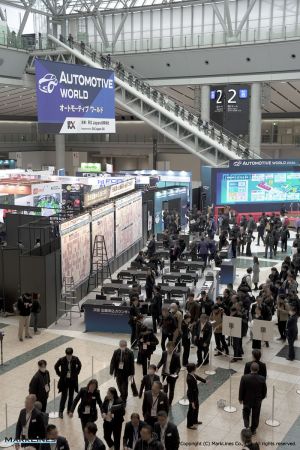
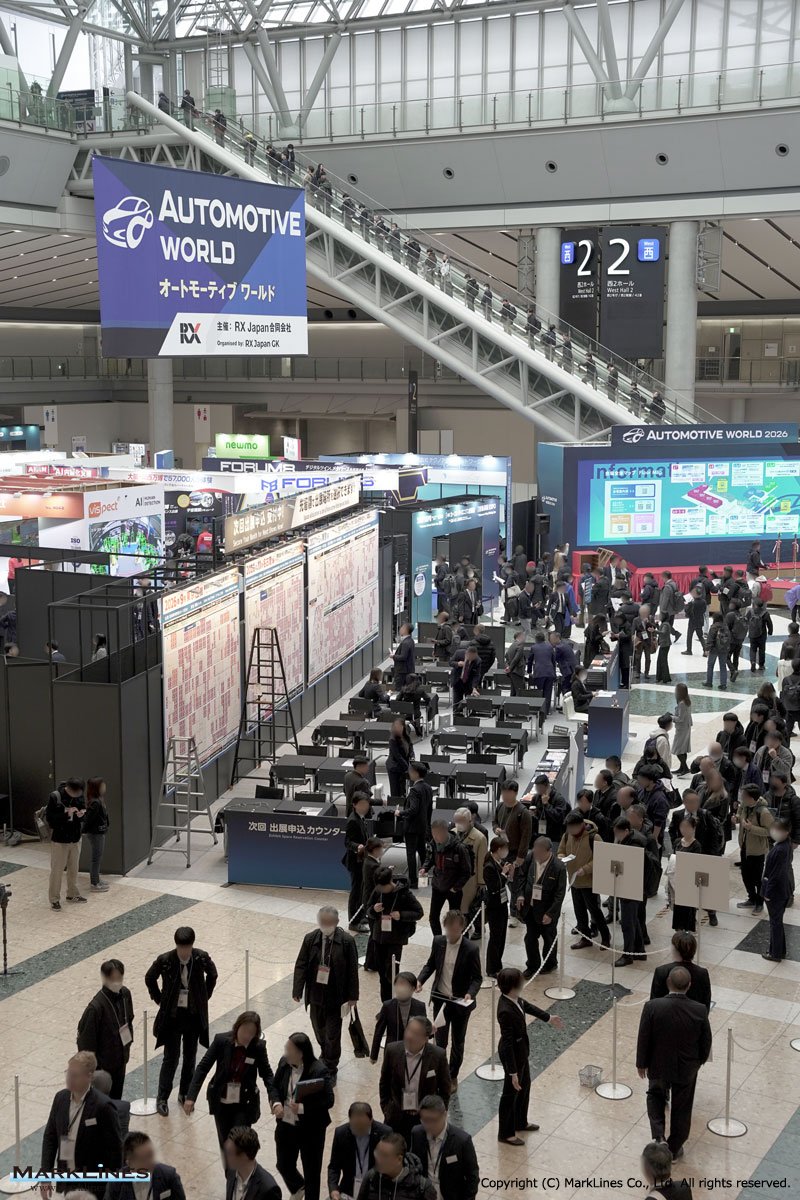
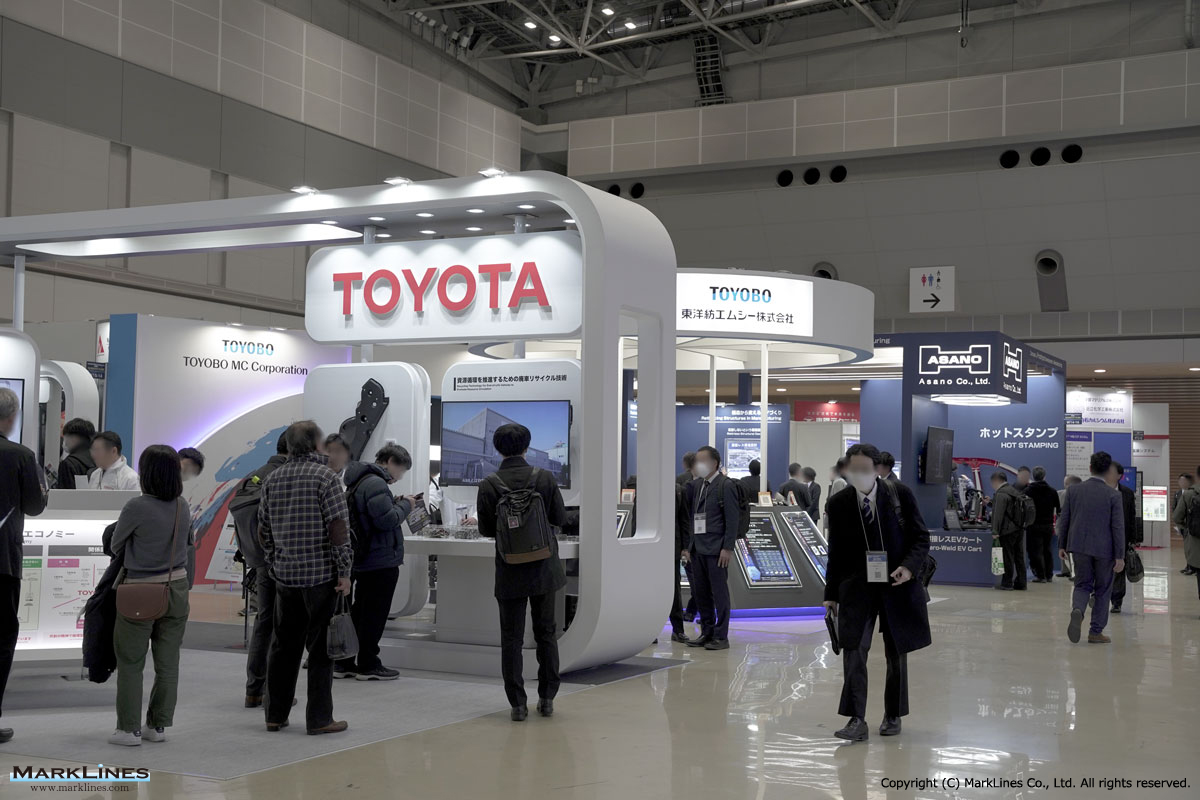
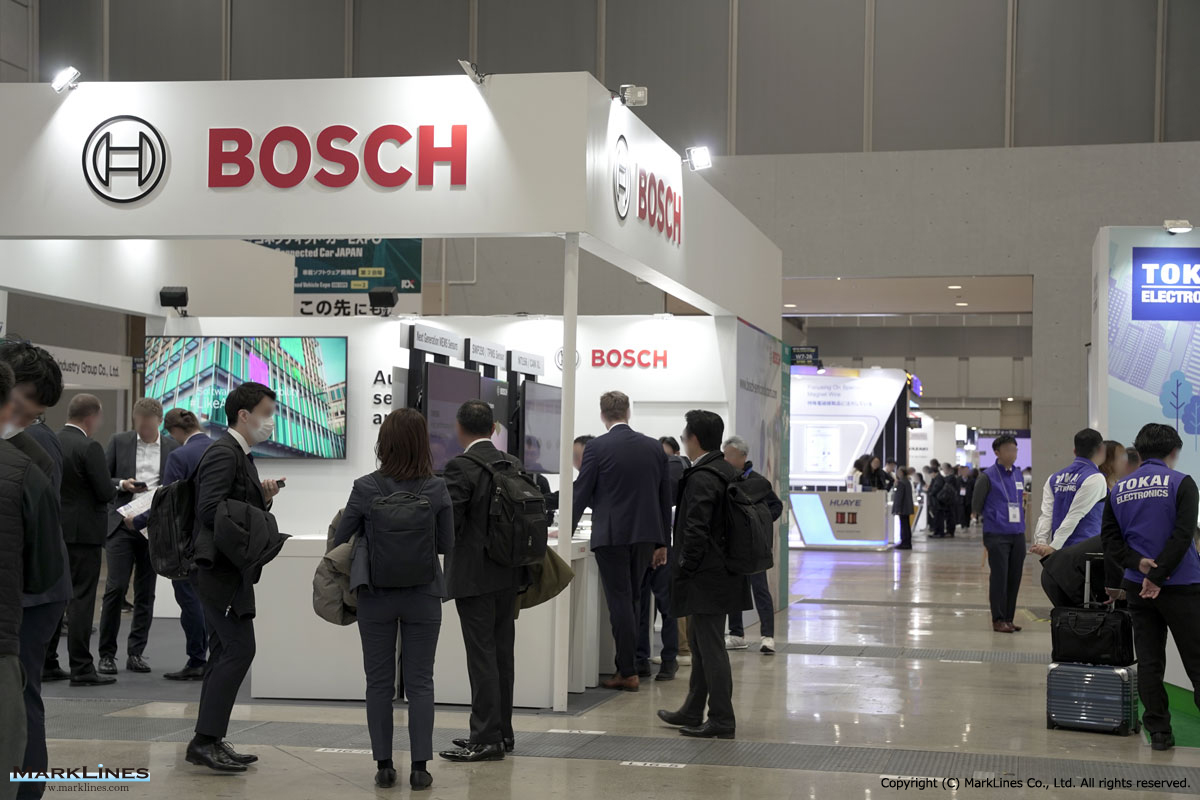
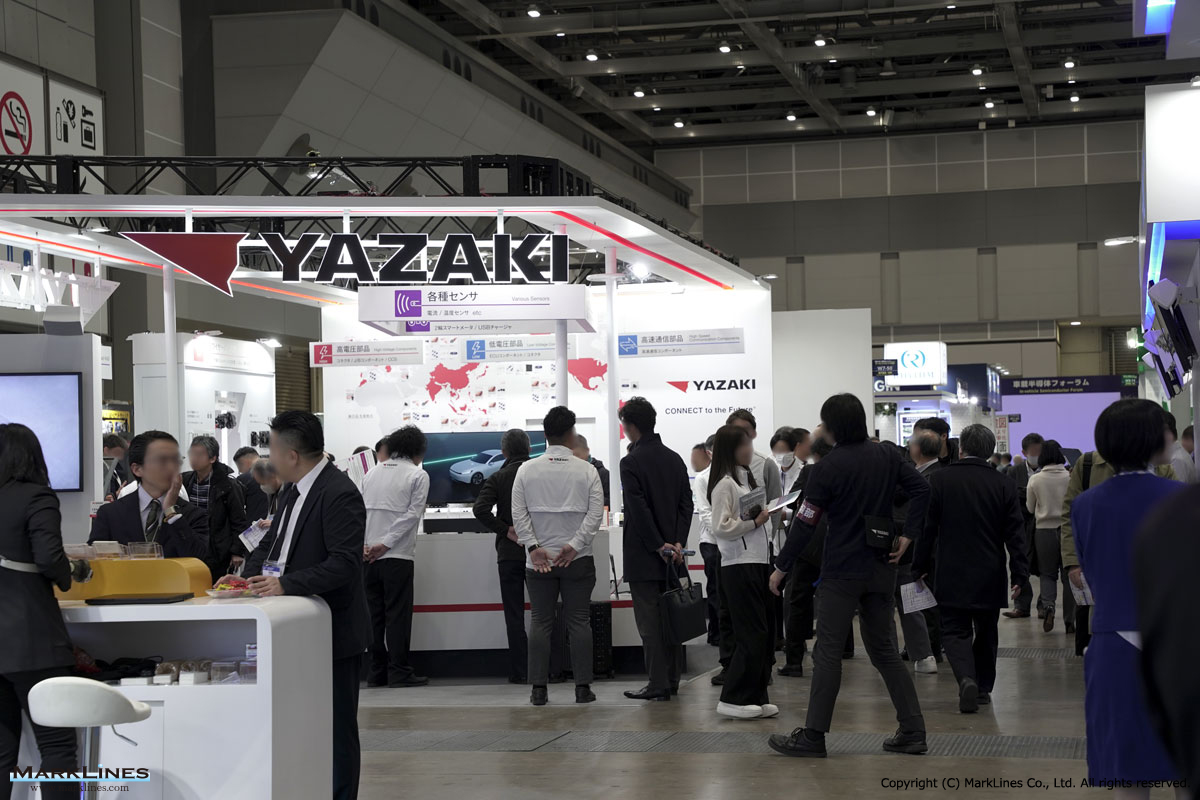
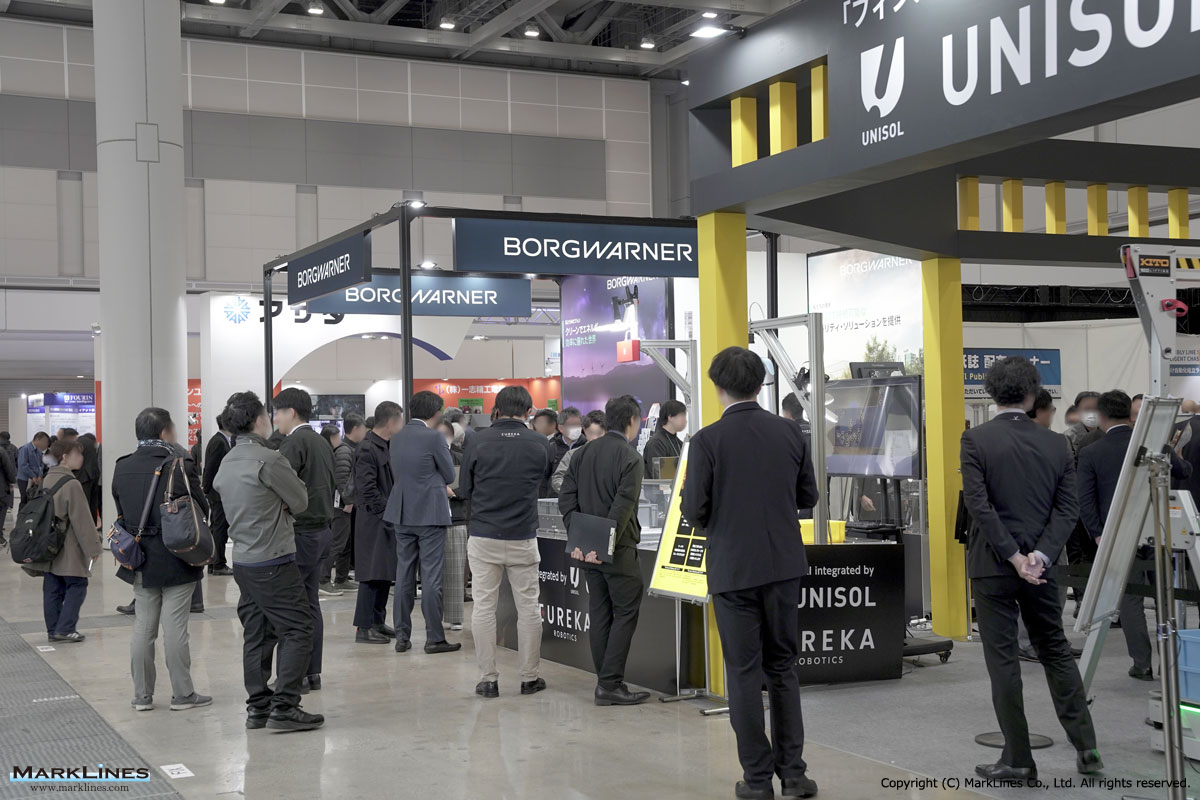
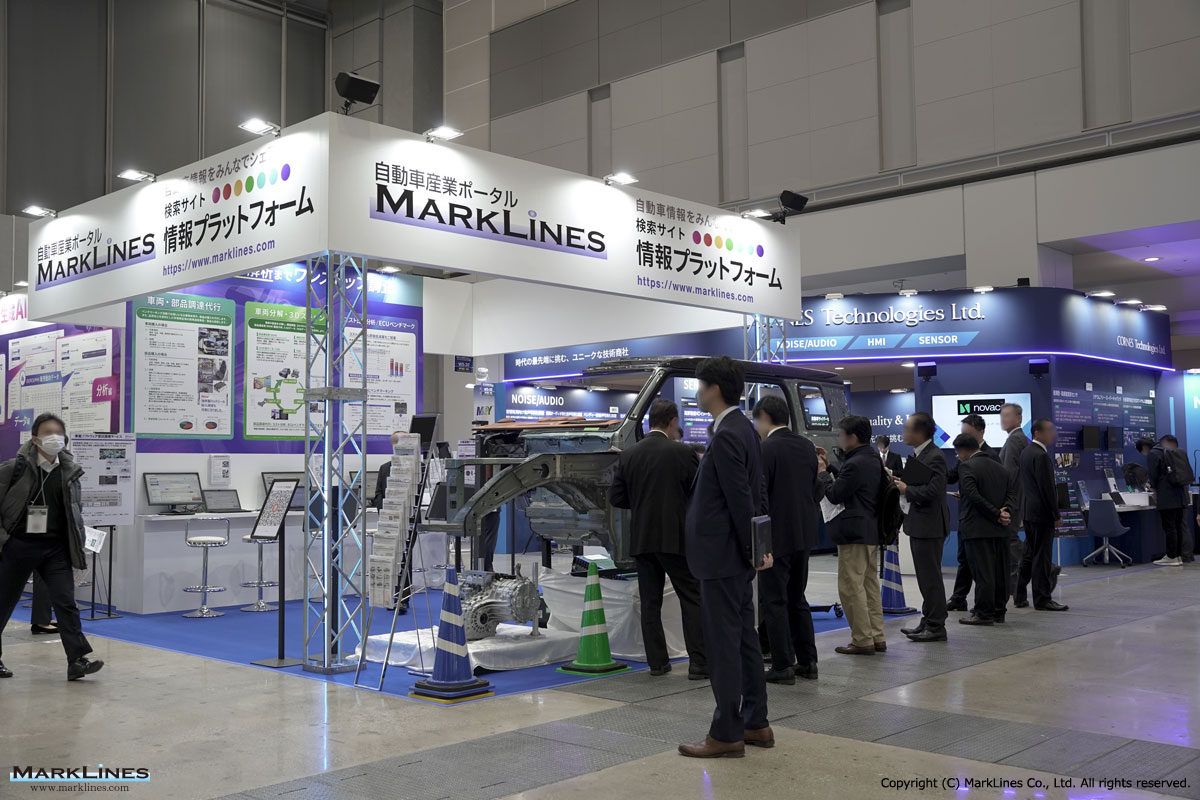
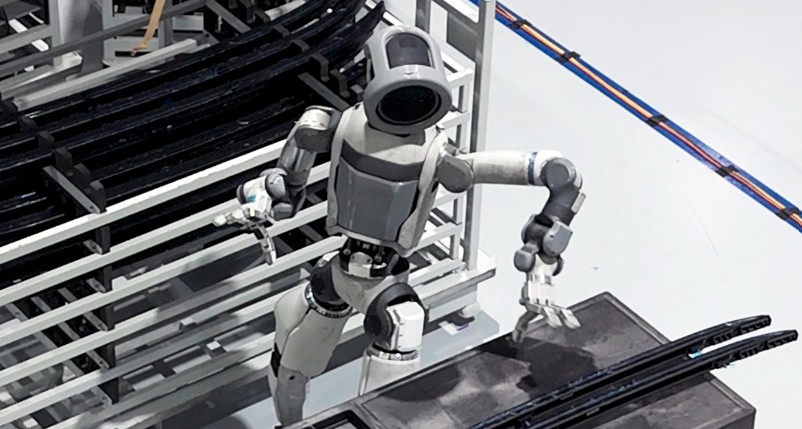
On-site Flash News: Automotive World 2026 opens
 2
2
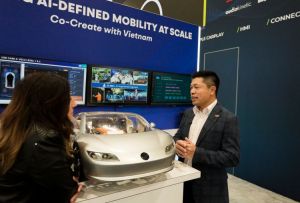
CES 2026: Vietnam-based tech firm FPT positions AI for production-ready mobility
 2
2
CES 2026: Hyundai reveals AI Robotics launch, production strategy
 1
1
CES 2026: Hyundai Motor Group to unveil AI Robotics Strategy
 2
2
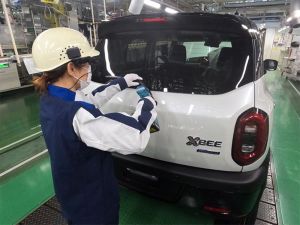
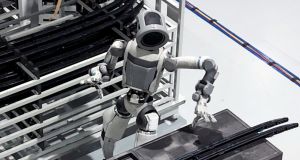
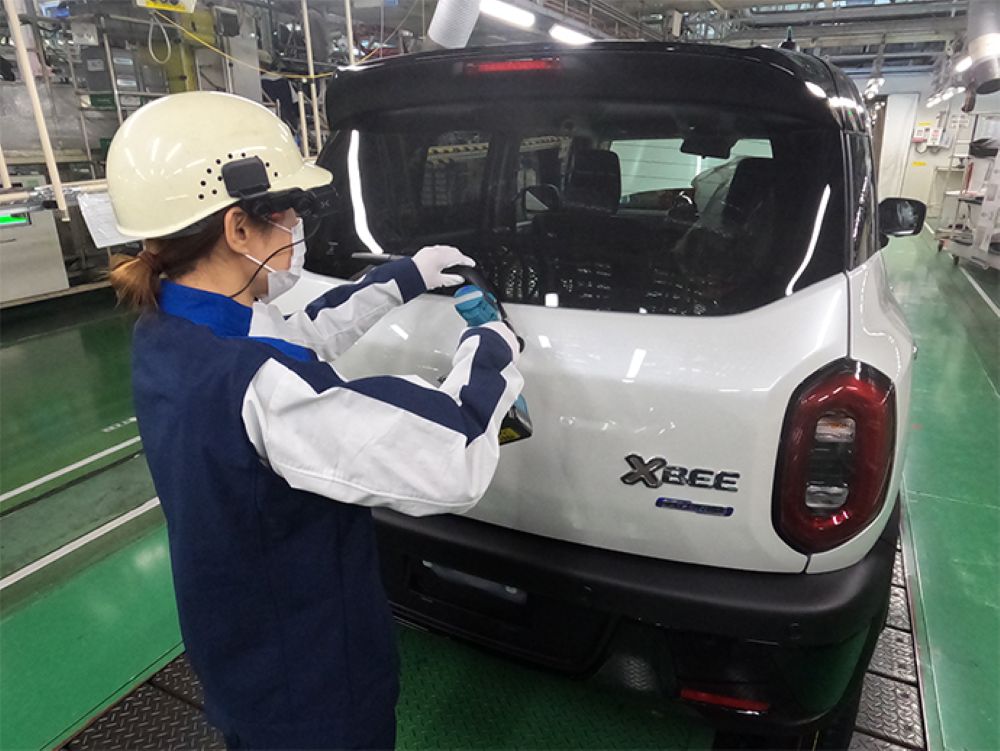
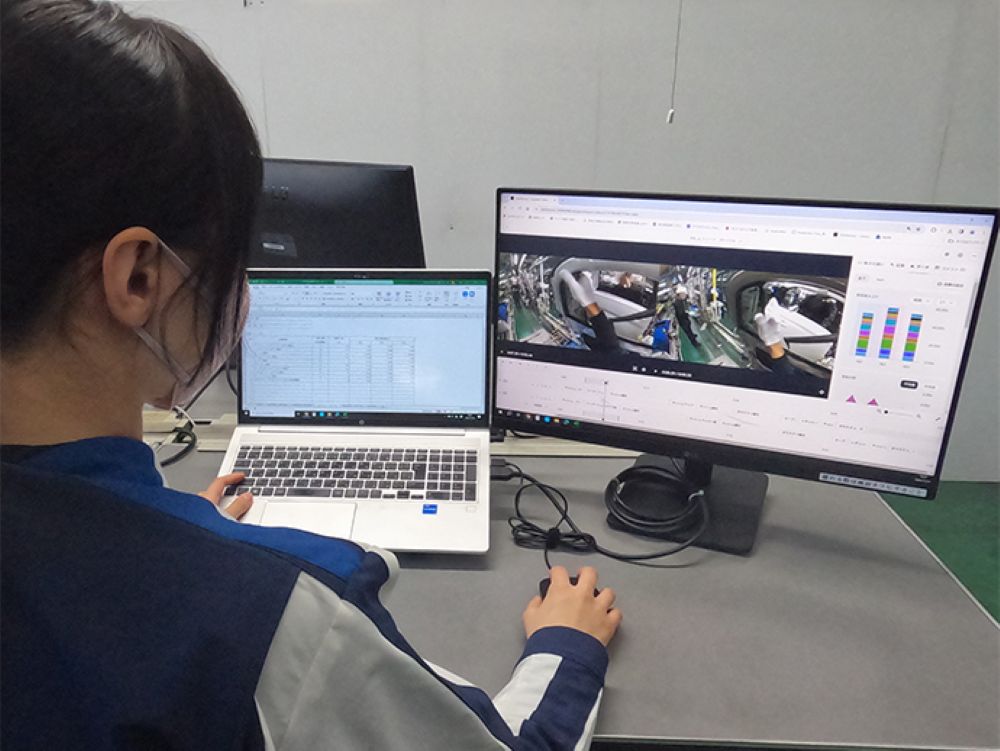
Suzuki introduces work analysis AI “Ollo Factory” at plants in Japan
Sort by :
1 - 2 of 2 results
Data changes for Sales Statistics
dded automakers 2011 2012 2013 Hyundai 48,897 52,391 43,172 Kia 18,403 26,267 19,323 Great Wall (GW) 6,198 7,755 5,988 Daihatsu 3,341 2,047 1,871 Chery 2,105 1,987 1,471 Foton 782 550 604 Proton 303 293 249 Haval 347 39 0 Total 80,376 91,329 72,678 August 20, 2013 Uzbekistan(Factory Shipment) Sales volume for May 2013 has been revised from 13,968 units to 848 units for Chevrolet Epica/Captiva/Malibu. July 31, 2013 China ...
Automotive Sales Data Updated at: 2026/03/24
New Zealand - Flash report, Sales volume, 2014
2 0.0% 81 0.1% Maserati 1 0.0% 71 0.1% Mahindra & Mahindra 6 0.1% 58 0.1% Can-Am 3 0.0% 53 0.1% MG 1 0.0% 49 0.1% Bentley - -% 26 0.0% Daihatsu - -% 23 0.0% Aston Martin - -% 20 0.0% McLaren 3 0.0% 16 0.0% Ferrari 2 0.0% 15 0.0% Lamborghini - -% 10 0.0% Morgan 2 0.0% 9 0.0% Factory Built 1 0.0% 7 0.0% Rolls Royce - -% 7 0.0% Yamaha 5 0.1% 5 0.0% Trike - -% 4 0.0% Chevrolet - -% 3 0.0% Lotus - -% 3 0.0% Foton -...
Automotive Sales Data Updated at: 2015/01/13


 Japan
Japan USA
USA Mexico
 Germany
 China (Shanghai)
 Thailand
 India
India