


Search Results by Category
All information related to {{ key_word }}.
AI Navigator will guide you. Click here for information about {{ key_word }}.
Images
 1
1
FIOM raises alarm over job cuts, lower production and market share decline for Stellantis Italy
 5
5
Ford’s California Electric Vehicle Development Center on display
 4
4
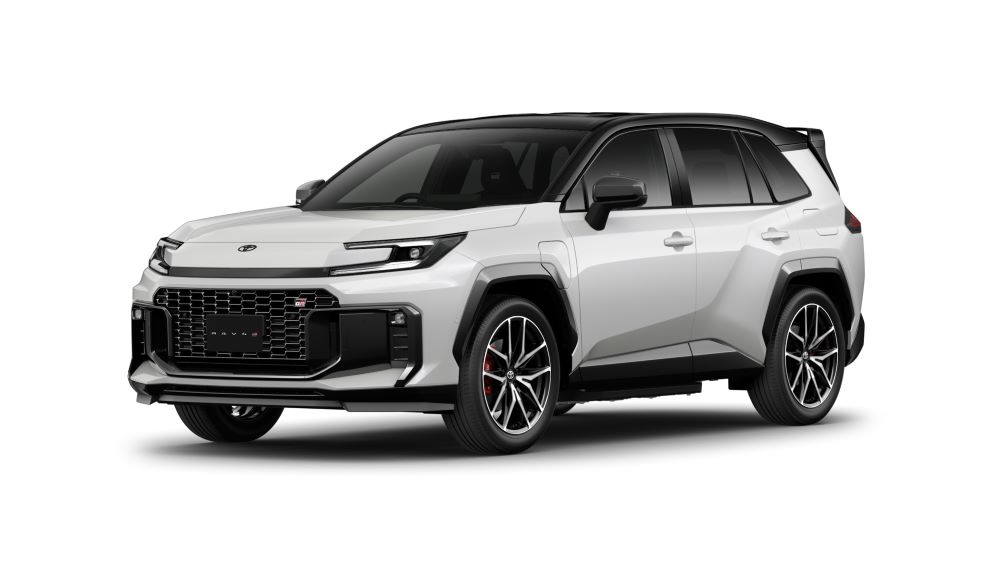
Toyota to launch RAV4 (PHEV) in Japan
 8
8
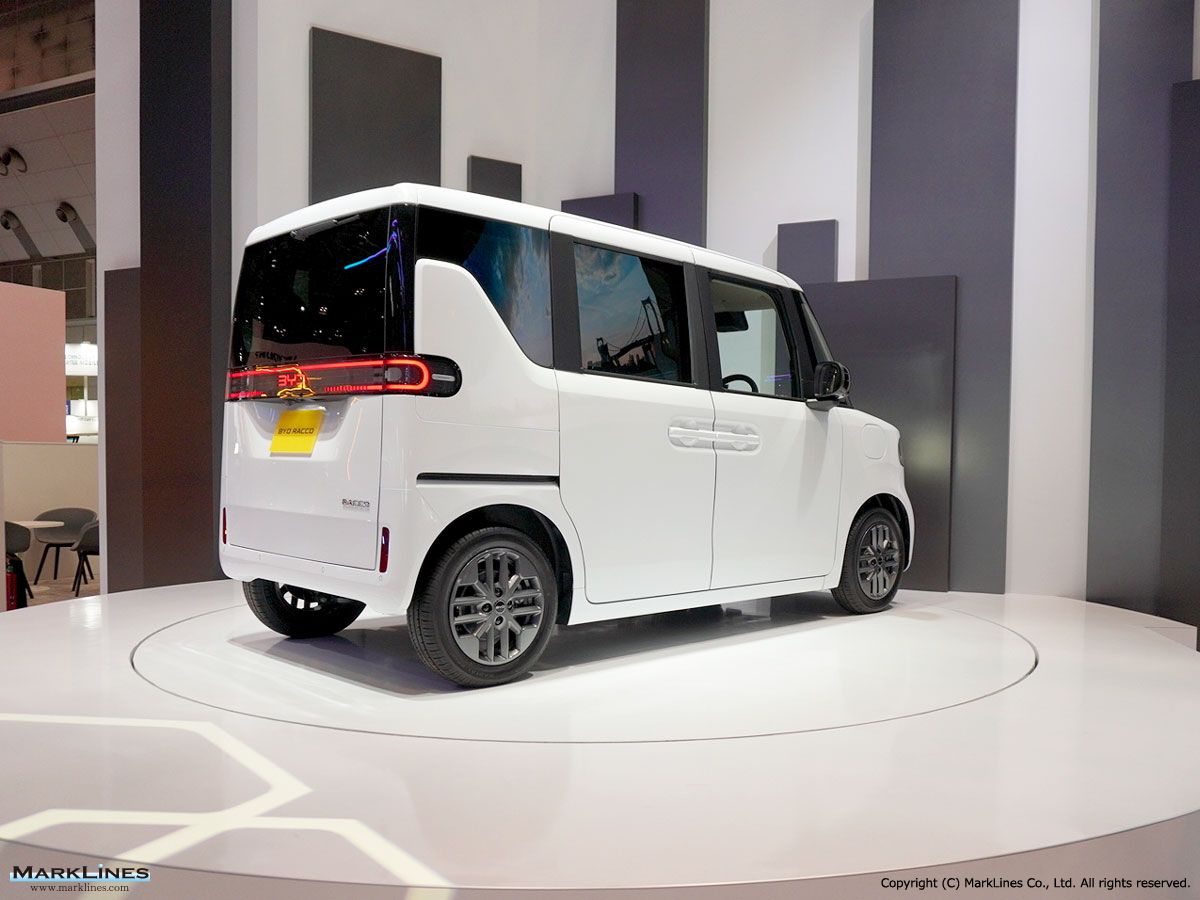
JMS 2025: BYD exhibits 13 models including the world premiere of the T35 light-duty electric truck and the RACCO mini EV prototype
 1
1
PLN introduces HCS Ultima new Home EV Charging Service in Indonesia
 10
10
Auto Shanghai 2025 officially opened
 1
1
Wuling signs MOU with PT PLN’s subsidiary for EV charging stations in Indonesia
 4
4
BMW unveils sixth-generation eDrive technology with key advancements in Battery, Charging, and Electric Drive Systems
 2
2
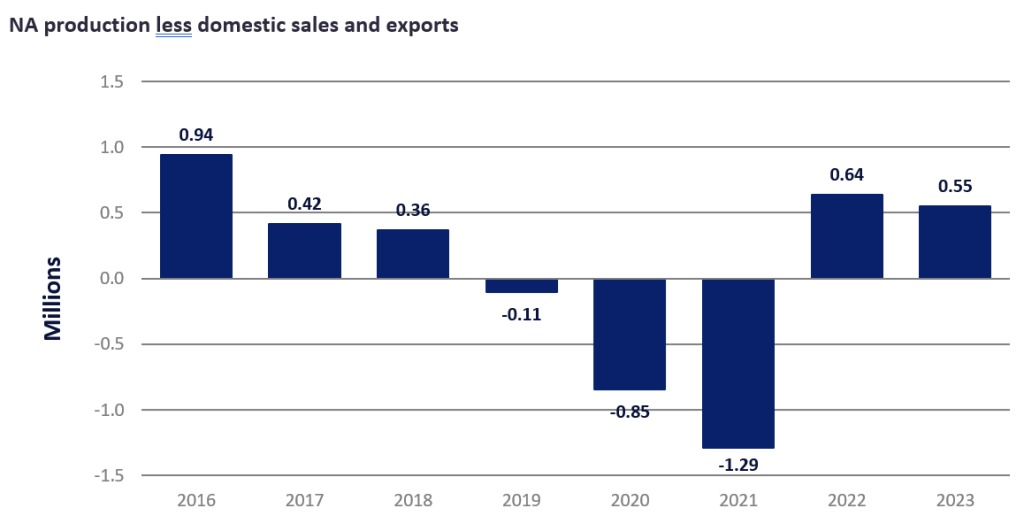
GlobalData blog: Nearly five years post-pandemic: where are we now?
 1
1
Italy’s DR Automobiles fined EUR 6 million for mislabeling Chinese-made cars
Sort by :
1 - 18 of 18 results
USA - New car sales in 2026 by OEM, model, vehicle type
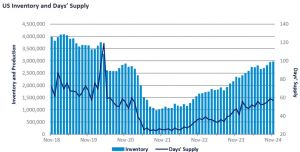
lectrified vehiclesNote: Some figures were updated on May 8.According to preliminary figures compiled by MarkLines as of May 2, U.S. new‐vehicle sales in April 2026 (including estimated figures for GM, Stellantis, Tesla, etc.) totaled 1,374,365 units, down 6.0% year on year. The number of selling days in April was the same as a year earlier, at 26 days.According to U.S. media reports, April auto sales were affected by persistently high vehicle ...
Automotive Sales Data Updated at: 2026/05/25
Malaysia - New car sales in 2026 by vehicle type
s of 2026 increased 1.6% from the same period in 2025 to 254,318 units.The number of Malaysian car production for April increased 24.8% over the previous year to 70,611 units. New car production for the first four months of 2026 decreased 1.8% from the same period in 2025 to 229,988 units.In April, supply improved significantly as production recovered following the Hari Raya festive holiday, while the launch of new models and enhanced promotional...
Automotive Sales Data Updated at: 2026/05/20
Korea - New car sales in 2026 by OEM
r (y/y), Hyundai Motor followed with a 19.9% decrease to 54,051 units (46.1% share). Renault Korea placed third with sales down 23.4% to 4,025 units (3.4% share), KGM down 4.6% to 3,382 units (2.9% share), and GM Korea down 38.8% to 811 units (0.7% share). Due to a decline in domestic demand, parts supply issues, and operational restrictions at some factories resulting from production adjustments, all brands except Kia saw a year-on-year decrease...
Automotive Sales Data Updated at: 2026/05/07
Philippines - New car sales in 2025 by vehicle type
ts recorded, comprising 1,750 HEVs, 379 BEVs, and 94 PHEVs.Rizal Commercial Banking Corp.’s chief economist noted that the yearly decline may partly reflect a high base from 2024, alongside recent disruptions caused by typhoons, floods, and earthquakes, which reduced business activity and working days. Besides, rising popularity of motorcycles, seen as a more affordable and fuel-efficient alternative, may also have diverted demand from car purc...
Automotive Sales Data Updated at: 2026/02/26
China - New car sales in 2025 by OEM, model, vehicle type
unced that its December sales volume was 57,947 units, down 22.7% y/y, another decline after a 7-month gap. YTD sales volume totaled 653,024 units, down 6.3% y/y and declining for 7 consecutive years. The N6, Nissan’s first plug-in hybrid electric sedan model, secured over 10,000 locked orders 10 days after its December 1 launch. The HarmonySpace-featured Teana sedan, the world’s first fuel vehicle model with Huawei’s HarmonySpace cockpit, ...
Automotive Sales Data Updated at: 2026/02/10
Brazil - New car sales in 2025 by OEM, vehicle type
nits, and RAM Rampage with 26,135 units.Fenabrave estimates that sales of passenger and light commercial vehicles will grow by 3.0% YOY to 2,625,912 units in 2026.“If interest rates are reduced and the Law of the Framework of Guarantees is effectively implemented, there will be greater and better supply of credit for financings. In addition, the Sustainable Car Program, which reduced IPI for specific entry models, showed the positive impact on ...
Automotive Sales Data Updated at: 2026/02/09
Canada - New car sales in 2025 by vehicle type
o down from the 163,000 units sold in September 2025.However, the SAAR in October came in at 1.94 million, the strongest month since Q1 2025.DAC notes that with the trade situation as it is with tariffs and counter-tariffs still being unresolved, potential threats of further semiconductor and other supply chain disruption, and a new Canadian Federal Budget coming and USMCA talks to yet begin, the rest of the year looks to be “interesting.” Ca...
Automotive Sales Data Updated at: 2026/02/05
USA - New car sales in 2025 by OEM, model, vehicle type
ar to 16.39 million unitsNote: Some figures were updated on January 21.MarkLines' data compiled as of January 6, 2026, shows that U.S. new car sales for December 2025 were 1,476,588 units, down 1.5% year-on-year, and 16,390,701 units for the full year, up 2.7% year-on-year. December had 26 business days, one more than the same month last year. Light vehicle seasonally adjusted annual rate (SAAR) for December was 16.0 million units versus 16.8 mil...
Automotive Sales Data Updated at: 2026/02/04
Spain - New car sales in 2025 by OEM
ining for eight consecutive months to the increase, which, to this day, allows us to be optimistic that we will return to more than a million units sold this year. The major blackout has had no impact on the market, as the units that were not registered on that day were carried out in the following days. The drive for sales in the Valencia Community by aid from the Reboot Auto+ scheme for vehicles affected by DANA remains an important stimulus fo...
Automotive Sales Data Updated at: 2026/02/03
USA - New car sales in 2024 by OEM, model, vehicle type
were updated on January 15.The number of new vehicles sold in the U.S. in December 2024 (preliminary figures including estimates for GM/Stellantis/Tesla, etc.), as aggregated by MarkLines as of January 6, was 1,494,776 units, up 2.0% from the same month of the previous year. The number of business days in December was 25, one less than the same month last year. Full-year sales were up 2.3% y/y to 15,976,559 units. Light vehicle seasonally adjust...
Automotive Sales Data Updated at: 2025/07/03
Canada - New car sales in 2024 by vehicle type
ports and confirmed data. Canadian auto sales up 8.8% in OctoberOn November 4, DesRosiers Automotive Consultants reported that an estimated 162,000 units were sold in Canada in October, up an enthusiastic 8.8% from the same month in 2023, due in part to the fact that October 2024 had 2 more selling days than October 2023.The SAAR for September 2024 came in at a robust 1.98 million, behind the pent-up demand explosion in January and February, but ...
Automotive Sales Data Updated at: 2025/07/02
USA - Flash report, Automotive sales volume, 2023
gures were updated on Jan. 11.U.S. light vehicle sales in December of 1,454,597 units were up 13.0% as compared to the same month in 2022.Truck and SUV sales increased 15.7% from last December to 1,180,944 units, while passenger car sales increased 2.8% to 273,653 units.December 2023 had 26 selling days in 2023, one less than the 27 in December 2022.Light vehicle seasonally adjusted annualized sales (SAAR) for December 2023 was 16.08 million unit...
Automotive Sales Data Updated at: 2025/06/04
USA - Flash report, Automotive sales volume, 2022
e been updated. January 11, 2023U.S. light vehicle sales in December of 1,287,280 units were up 5.4% as compared to the same month in 2021.Truck and SUV sales increased 5.3% from last December to 1,020,952 units, while passenger car sales increased 5.7% to 266,328 units.December 2022 had 27 selling days in 2022, the same as in December 2021.Light vehicle seasonally adjusted annualized sales (SAAR) for December 2022 was 13.60 million units versus ...
Automotive Sales Data Updated at: 2025/06/04
Update History for Sales Statistics (2022)
. 2 Apr. 4 May 6 Jun. 2 Jul. 4 Aug. 3 Sep. 2 Oct. 4 Nov. 2 Dec. 2 Jan. 5 USA (EV) Feb. 4 Mar. 3 Apr. 6 May 6 Jun. 6 Jul. 6 Aug. 5 Sep. 6 Oct. 6 Nov. 4 Dec. 6 Jan. 12 USA (Medium & Heavy Trucks) Feb. 15 Mar. 11 Apr. 13 May 13 Jun. 15 Jul. 14 Aug. 12 Sep. 15 Oct. 14 Nov. 14 Dec. 15 Jan. 20 USA (Days supply by model) Feb. 28 Mar. 24 Apr. 22 May 26 Jun. 23 Jul. 26 Aug. 25 Sep. 28 Oct. 25 Nov. 22 Dec. 22 Jan. 25 Canada Feb. 10 Mar. 7 Apr. 5 Ma...
Automotive Sales Data Updated at: 2023/04/04
Update History for Automotive Sales Statistics (2021)
r. 3 Apr. 2 May 5 Jun. 3 Jul. 2 Aug. 4 Sep. 2 Oct. 4 Nov. 3 Dec. 2 Jan. 5 USA (HV) Feb. 4 Mar. 4 Apr. 3 May 6 Jun. 4 Jul. 3 Aug. 5 Sep. 3 Oct. 5 Nov. 4 Dec. 3 Jan. 7 USA (Medium & Heavy Trucks) Feb. 12 Mar. 11 Apr. 13 May 13 Jun. 15 Jul. 14 Aug. 12 Sep. 14 Oct. 13 Nov. 11 Dec. 14 Jan. 14 USA (Days supply by model) Feb. 25 Mar. 24 Apr. 21 May 24 Jun. 23 Jul. 30 Aug. 25 Sep. 24 Oct. 25 Nov. 25 Dec. 23 Jan. 25 Canada Feb. 9 Mar. 8 Apr. 6 May...
Automotive Sales Data Updated at: 2022/03/28
Update History for Sales Statistics (2020)
a Country 2020 Jan. Feb. Mar. Apr. May Jun. Jul. Aug. Sep. Oct. Nov. Dec. USA Feb. 5 Mar. 5 Apr. 2 May 5 Jun. 3 Jul. 3 Aug. 4 Sep. 2 Oct. 2 Nov. 4 Dec. 2 Jan. 6 USA (Medium & Heavy Trucks) Feb. 13 Mar. 12 Apr. 15 May 14 Jun. 11 Jul. 14 Aug. 13 Sep. 15 Oct. 13 Nov. 12 Dec. 11 Jan. 14 USA (Days supply by model) Mar. 6 Apr. 3 May 1 May 29 Jun. 30 Aug. 3 Sep. 1 Sep. 29 Oct. 23 Nov. 20 Dec. 22 Jan. 22 Canada (Provisional Figures) Feb. 7 M...
Automotive Sales Data Updated at: 2021/03/31
Update History for Sales Statistics (2019)
a Country 2019 Jan. Feb. Mar. Apr. May Jun. Jul. Aug. Sep. Oct. Nov. Dec. USA Feb. 4 Mar. 5 Apr. 3 May 3 Jun. 4 Jul. 4 Aug. 2 Sep. 5 Oct. 3 Nov. 4 Dec. 4 Jan. 7 USA (Medium & Heavy Trucks) Feb. 14 Mar. 15 Apr. 11 May 22 Jun. 13 Jul. 11 Aug. 13 Sep. 12 Oct. 11 Nov. 13 Dec. 12 Jan. 15 USA (Days supply by model) Mar. 11 Apr. 9 May 10 May 31 Jul. 2 Jul. 30 Aug. 29 Oct. 1 Oct. 30 Nov. 26 Dec. 25 Jan. 31 Canada (Provisional Figures) Feb. 6...
Automotive Sales Data Updated at: 2020/04/01
Update History for Sales Statistics (2018)
ca Country 2018 Jan. Feb. Mar. Apr. May Jun. Jul. Aug. Sep. Oct. Nov. Dec. USA Feb. 2 Mar. 2 Apr. 4 May 2 Jun. 4 Jul. 4 Aug. 2 Sep. 5 Oct. 3 Nov. 2 Dec. 4 Jan. 4 USA (Medium & Heavy Trucks) Feb. 21 Mar. 22 Apr. 23 May 16 Jun.19 Jul. 19 Aug. 22 Sep. 21 Oct. 18 Nov. 21 Dec. 20 Jan. 23 USA (Days supply by model) Feb. 27 Mar. 27 Apr. 26 May 23 Jul. 5 Aug. 1 Sep. 5 Oct. 3 Oct. 25 Dec. 7 Jan. 7 Jan. 30 Canada (Provisional Figures) Feb. 7 M...
Automotive Sales Data Updated at: 2020/03/26


 Japan
Japan USA
USA Mexico
 Germany
 China (Shanghai)
 Thailand
 India
India