


Search Results by Category
All information related to {{ key_word }}.
AI Navigator will guide you. Click here for information about {{ key_word }}.
Images
 4
4
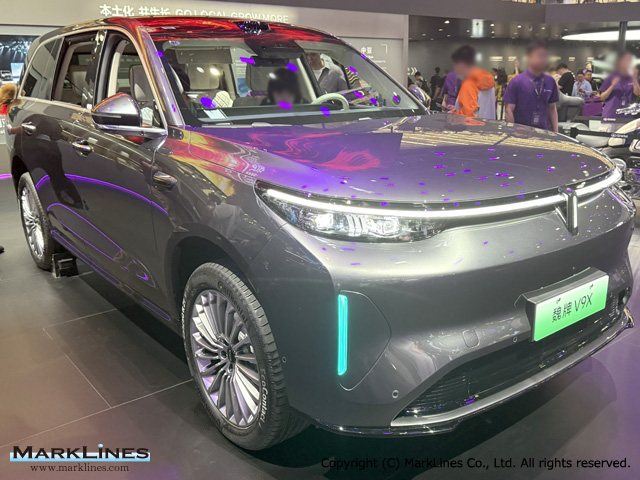
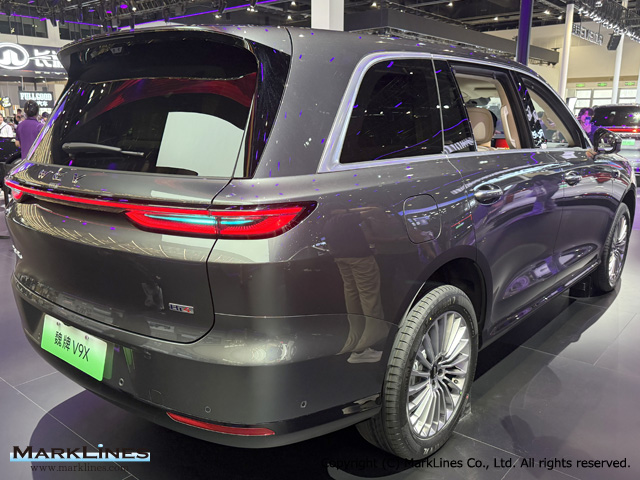
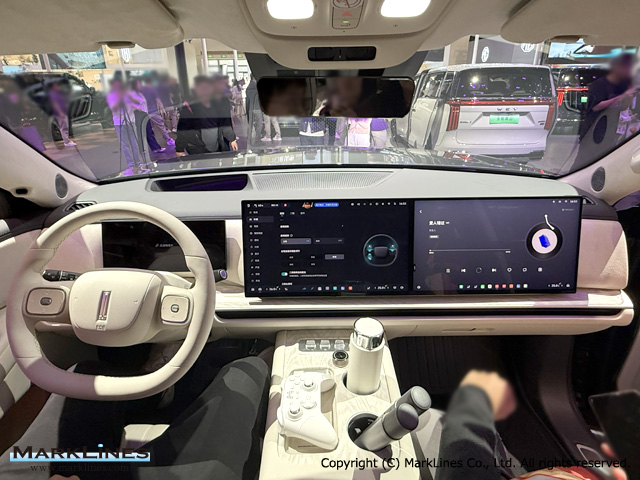
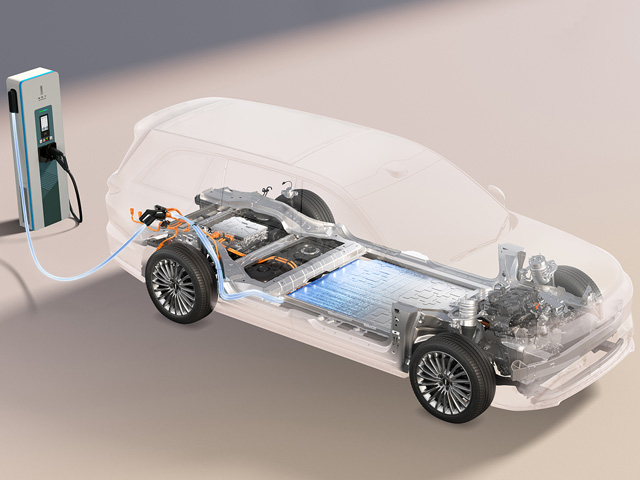
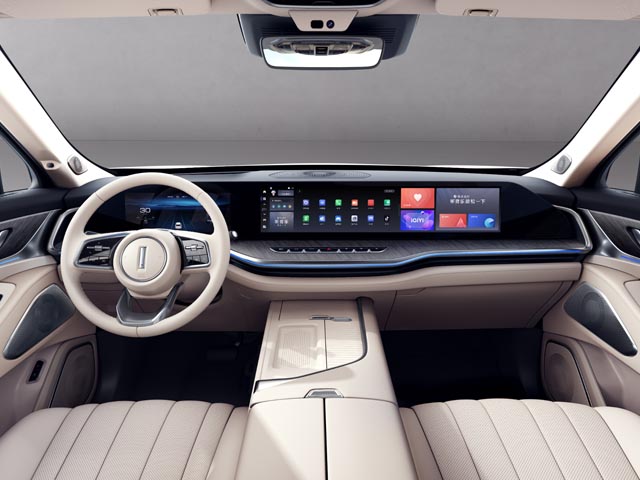
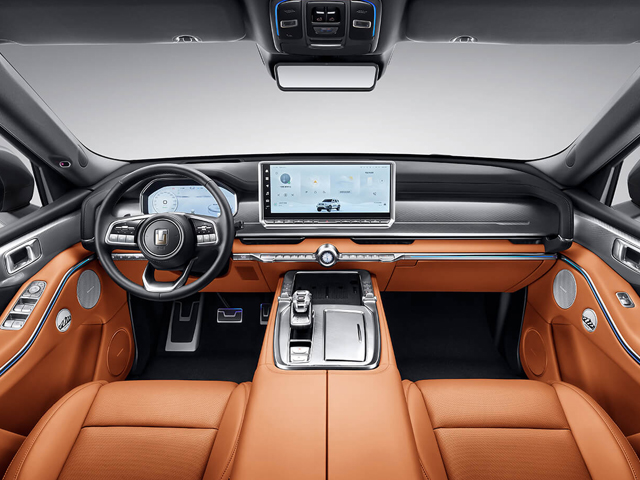
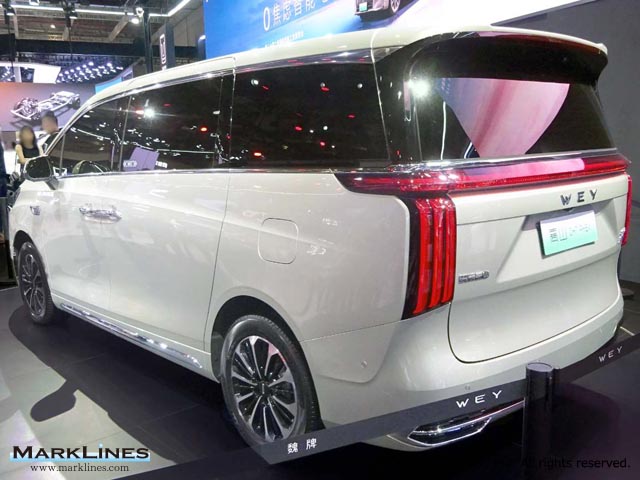
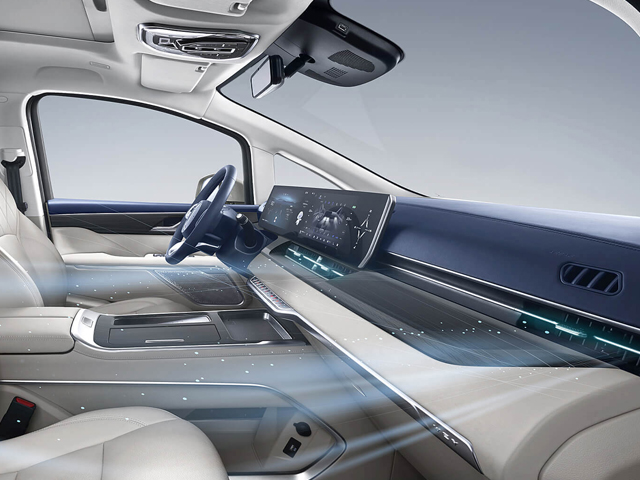
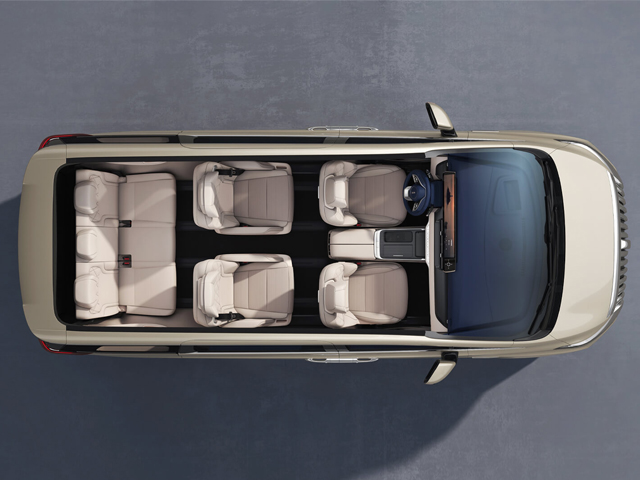
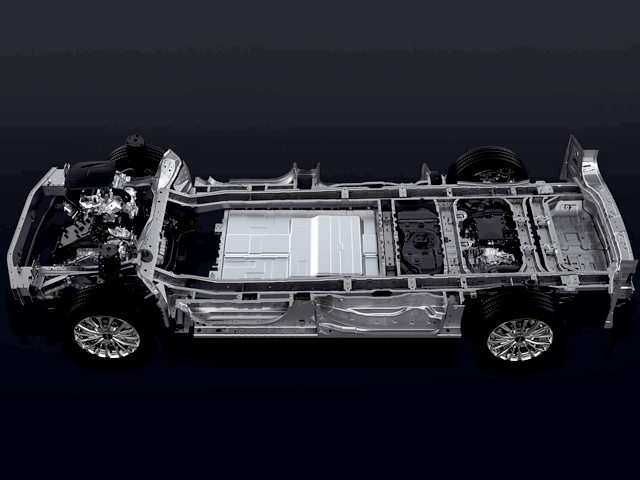
WEY V9X
 6
6
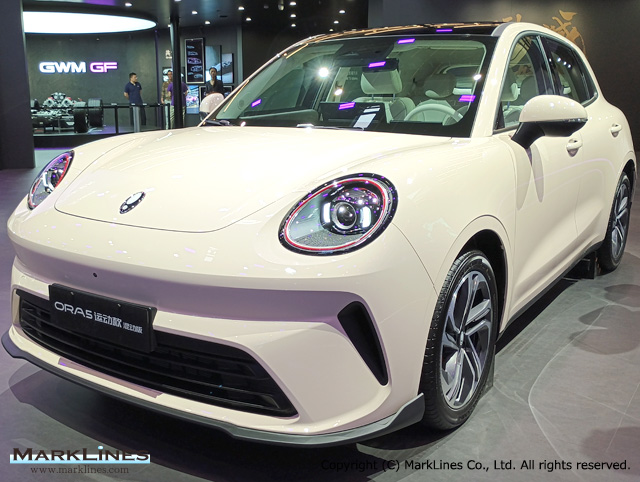
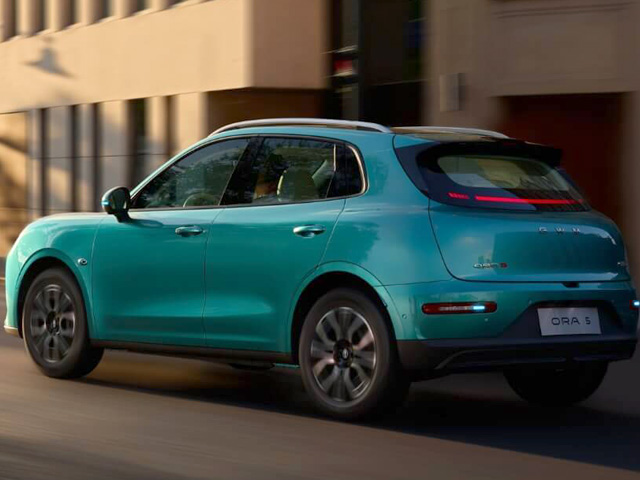
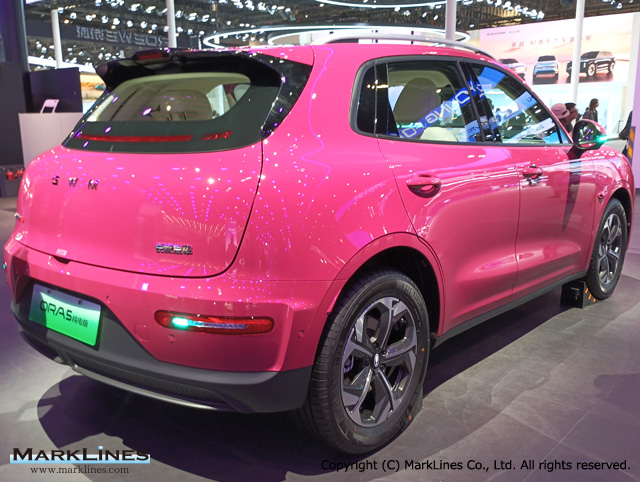
Ora 5 HEV
 7
7
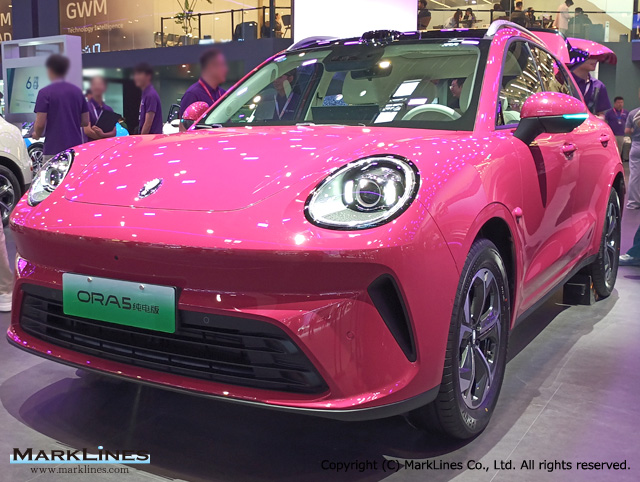
Ora 5 EV
 3
3
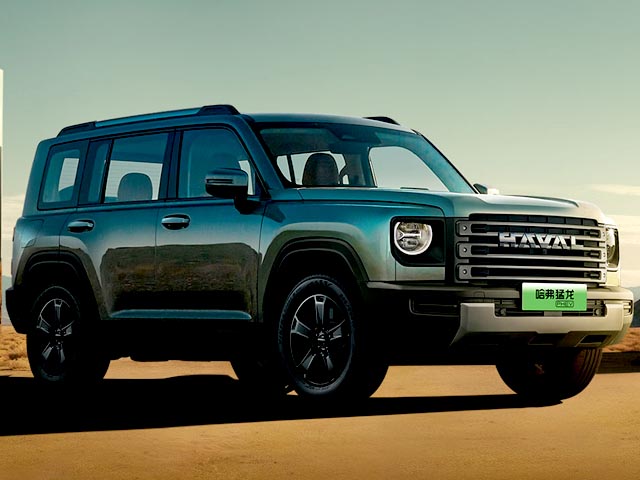
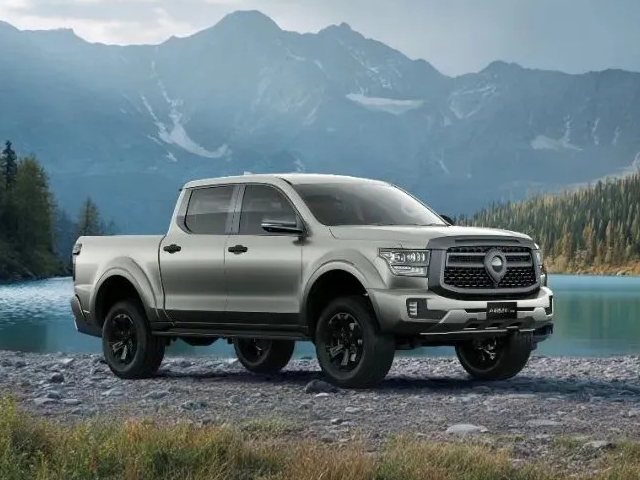
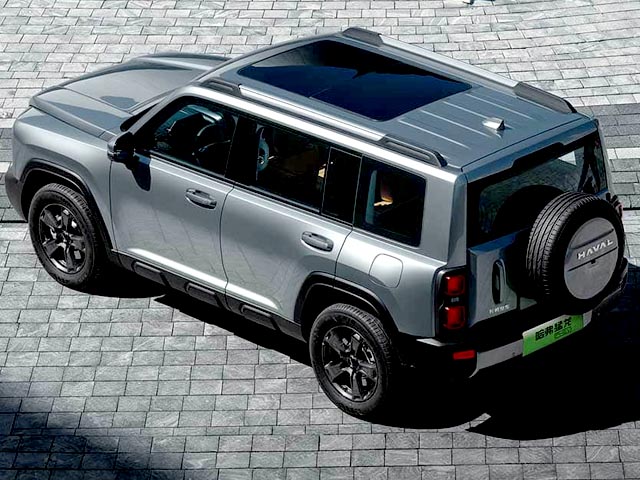
Haval Raptor
 3
3
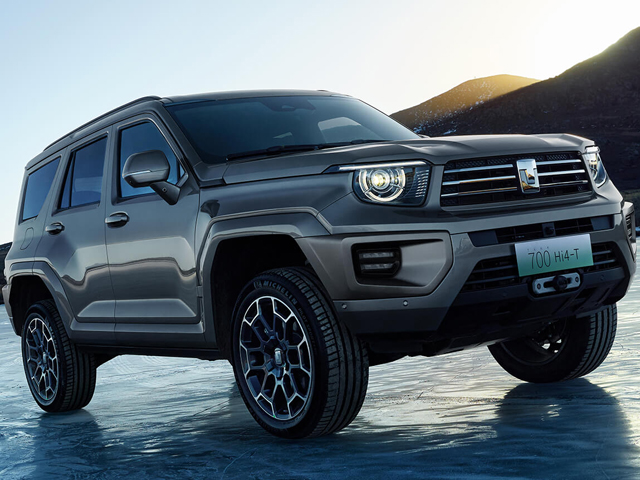
POER Sahar Hi4-T
 4
4
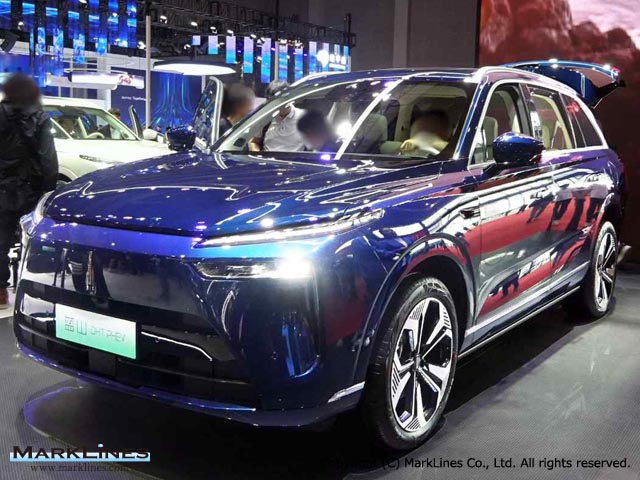
WEY Lanshan/07 DHT-PHEV
 5
5
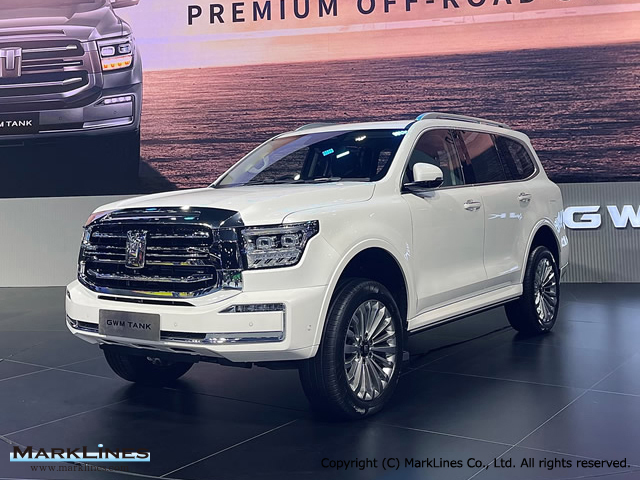
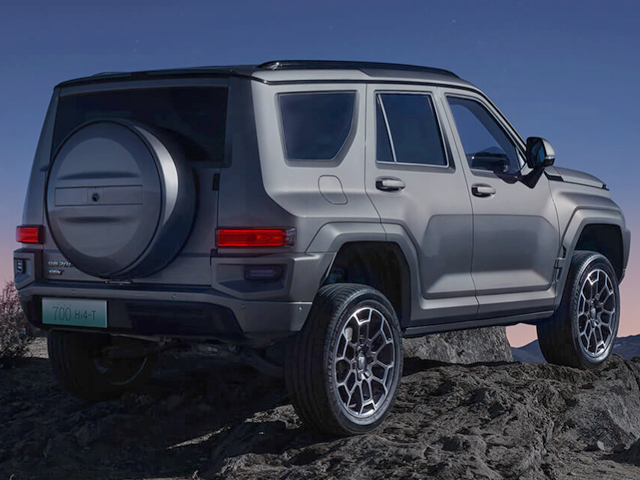
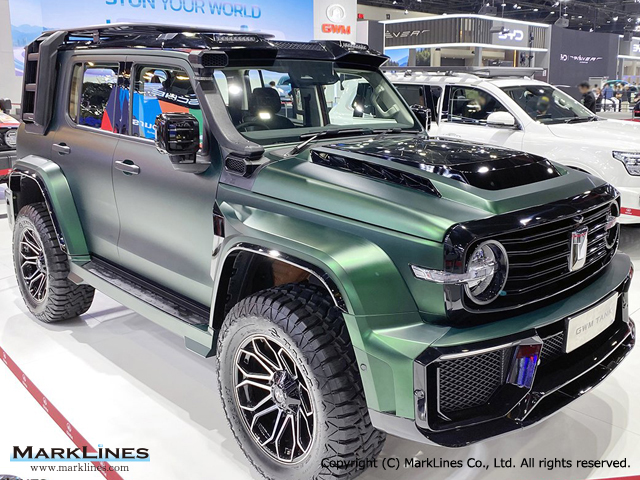
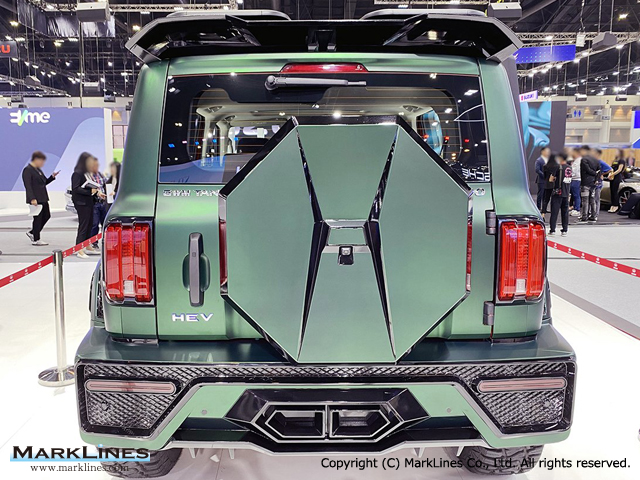
Tank 700 Hi4-T
 6
6
Tank 300/500 HEV
 5
5
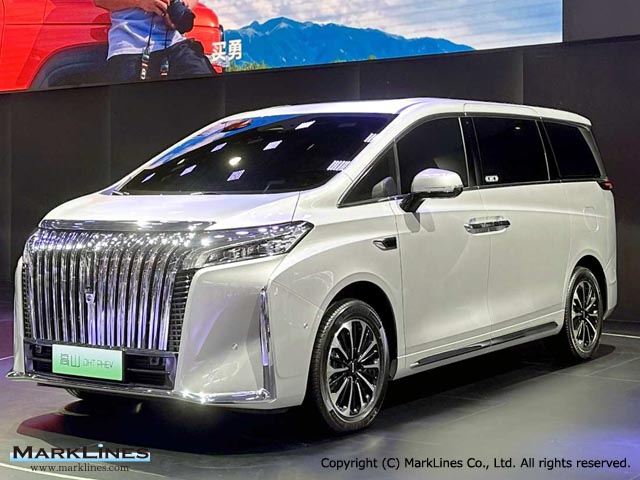
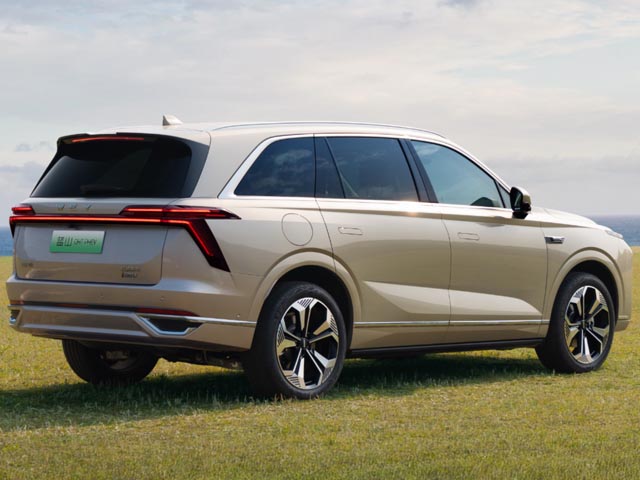
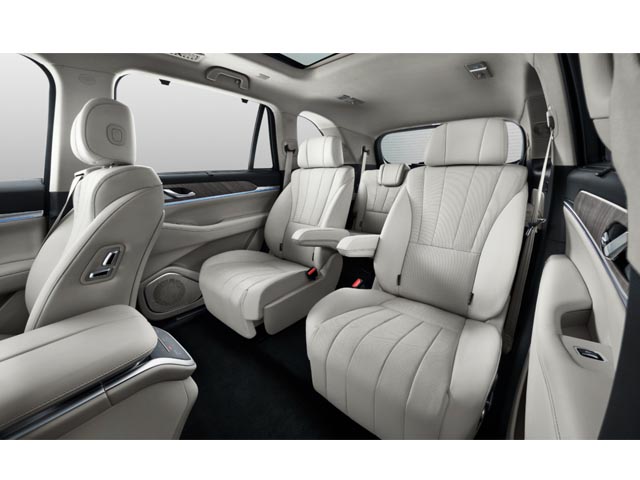
WEY Gaoshan/80 PHEV
 8
8
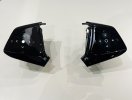
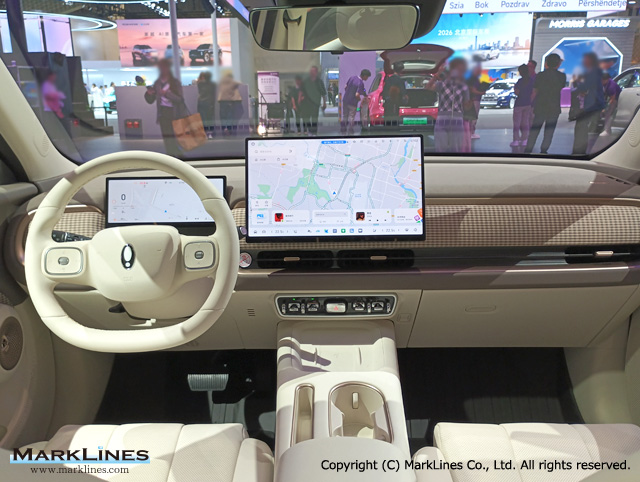
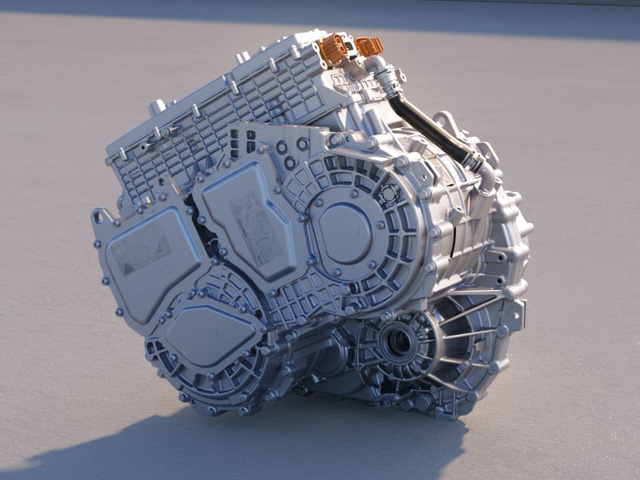
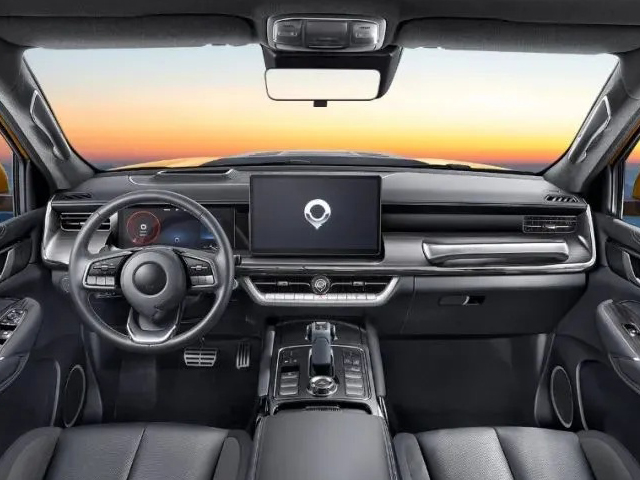
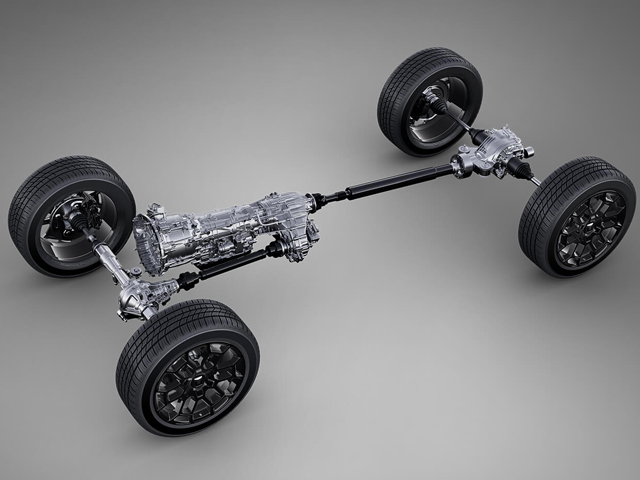
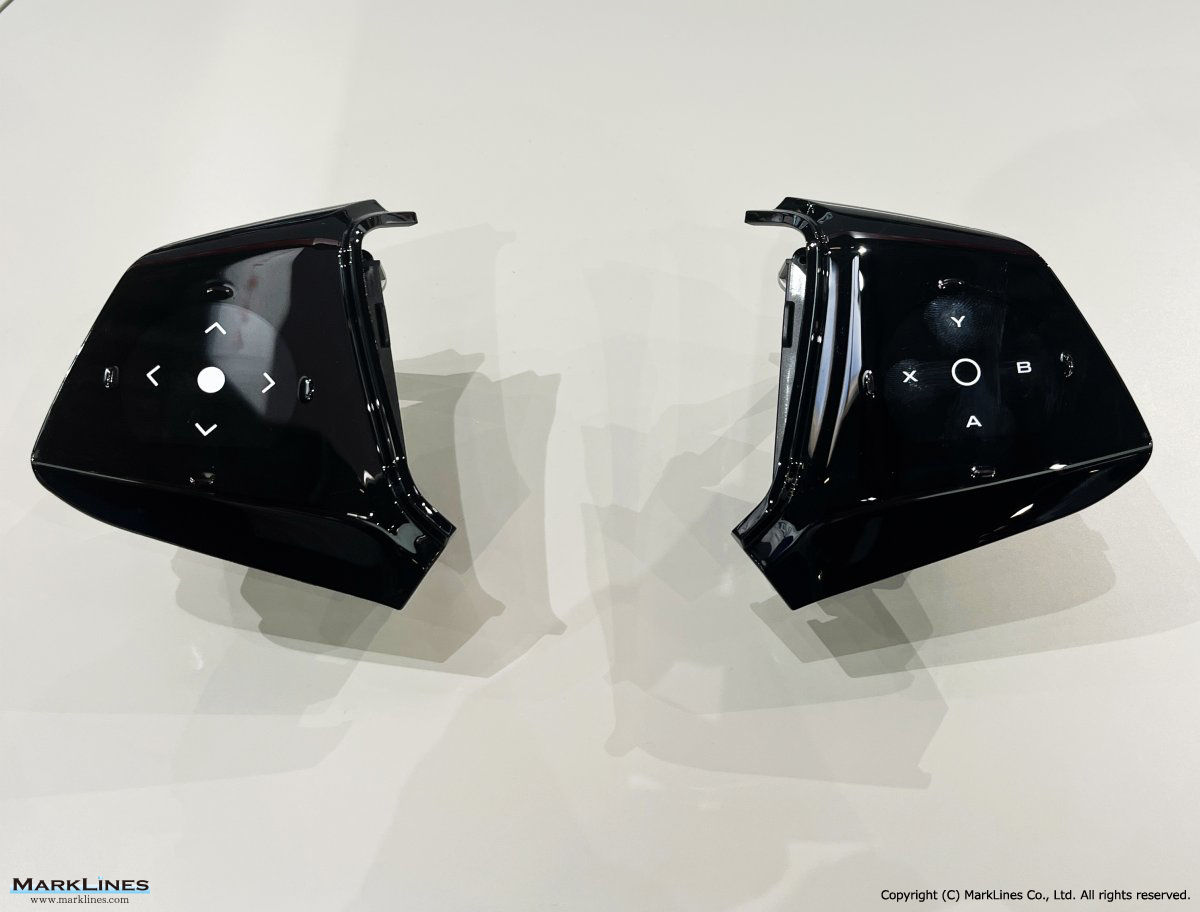
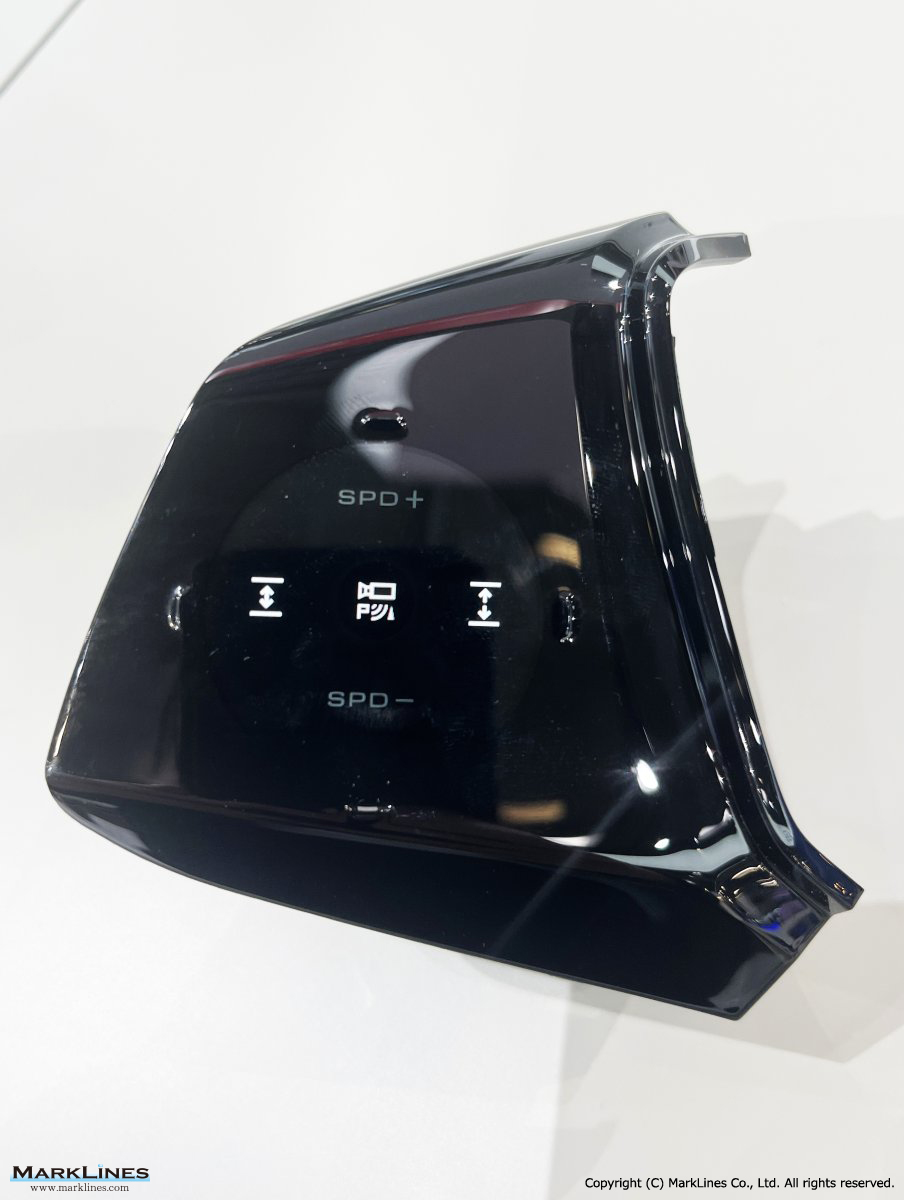
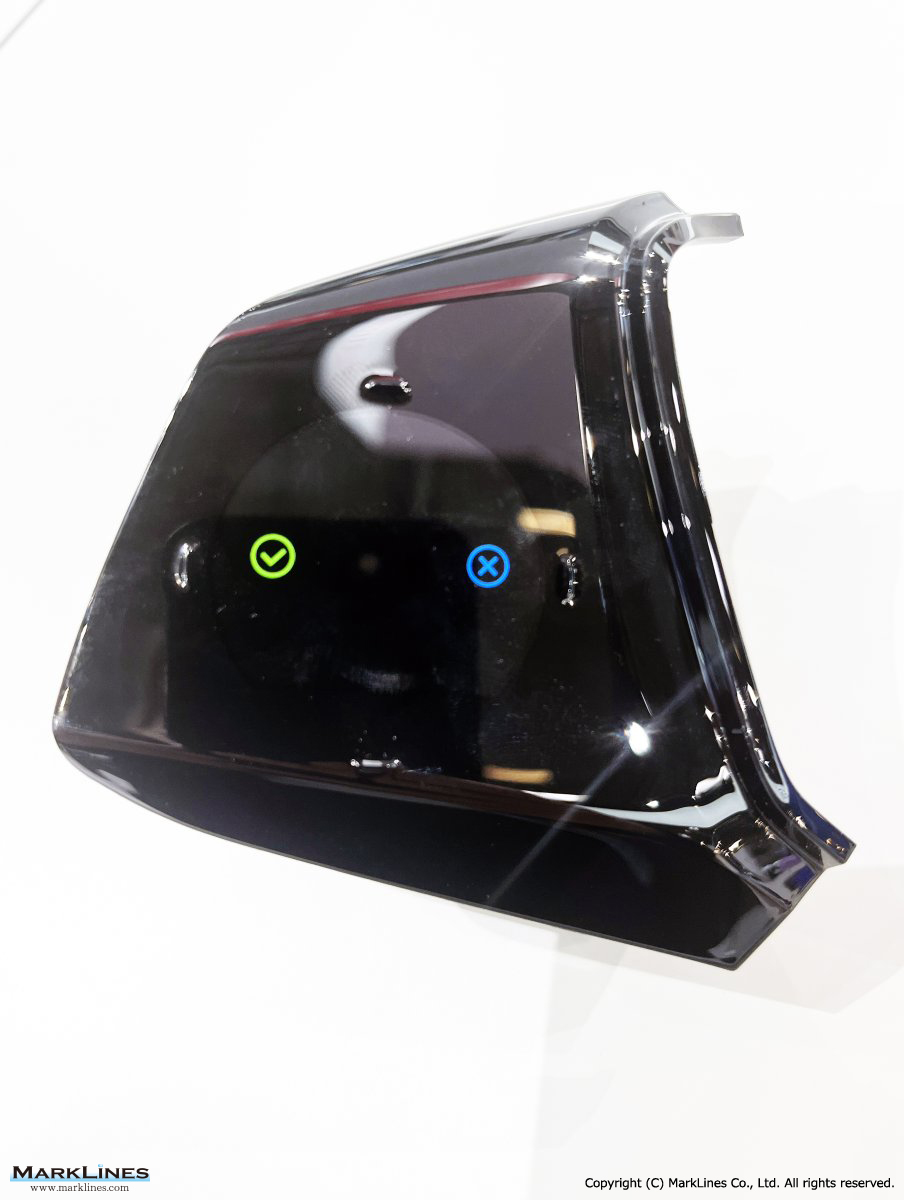
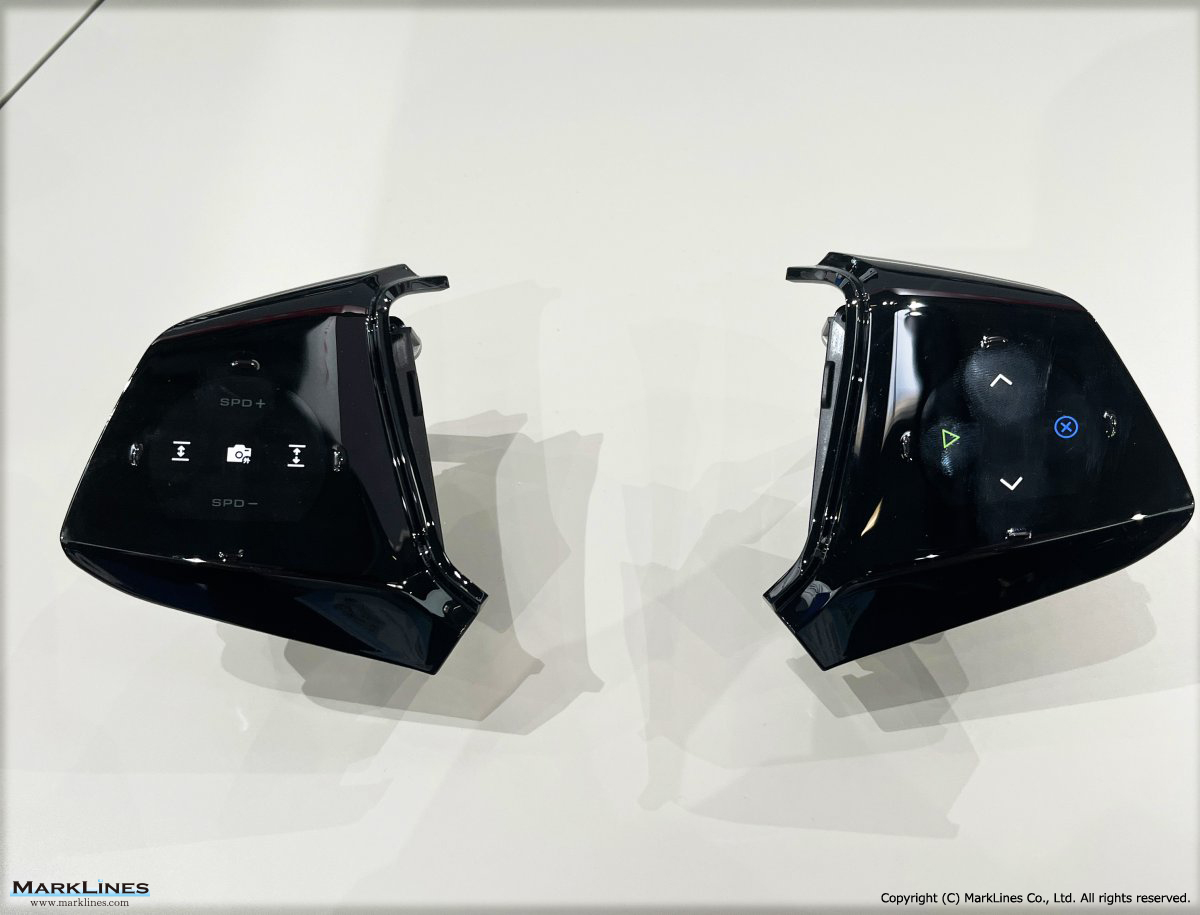
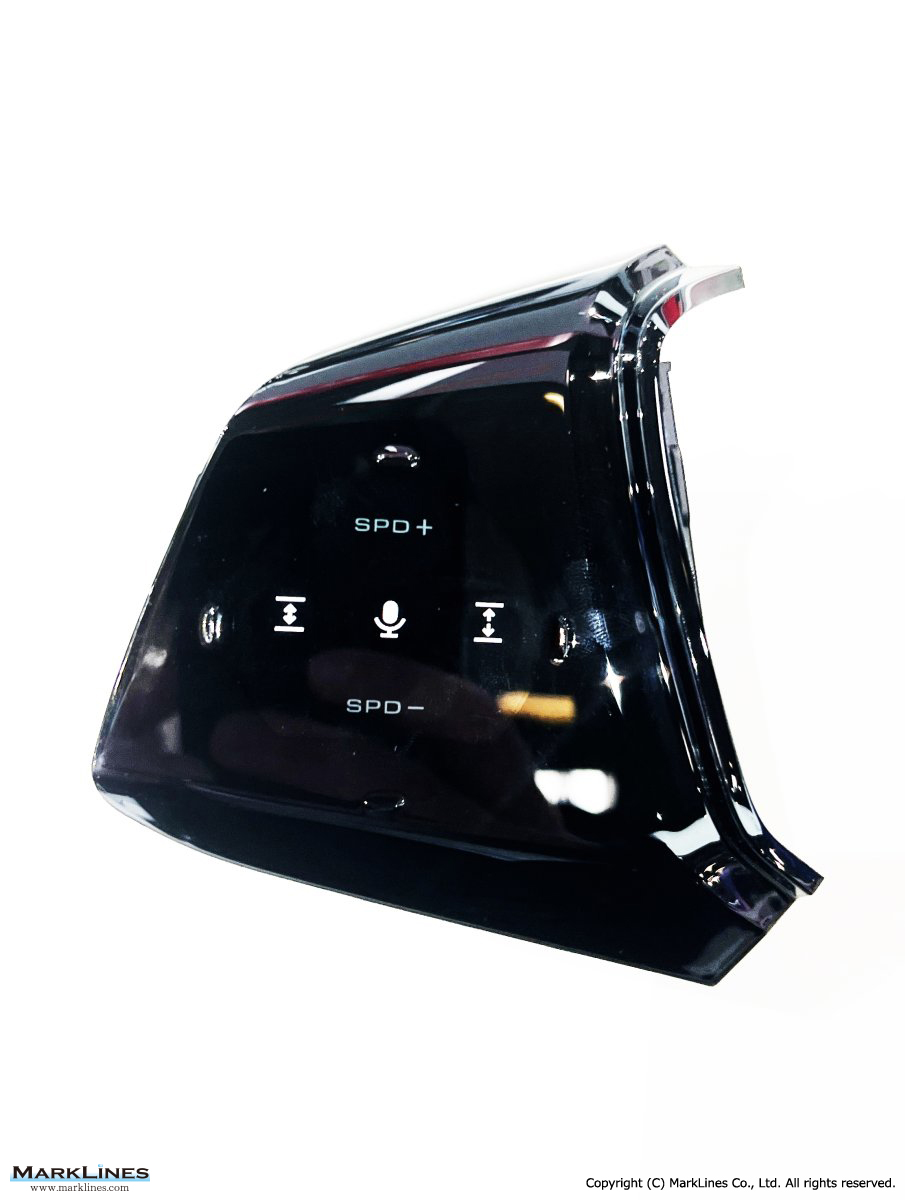
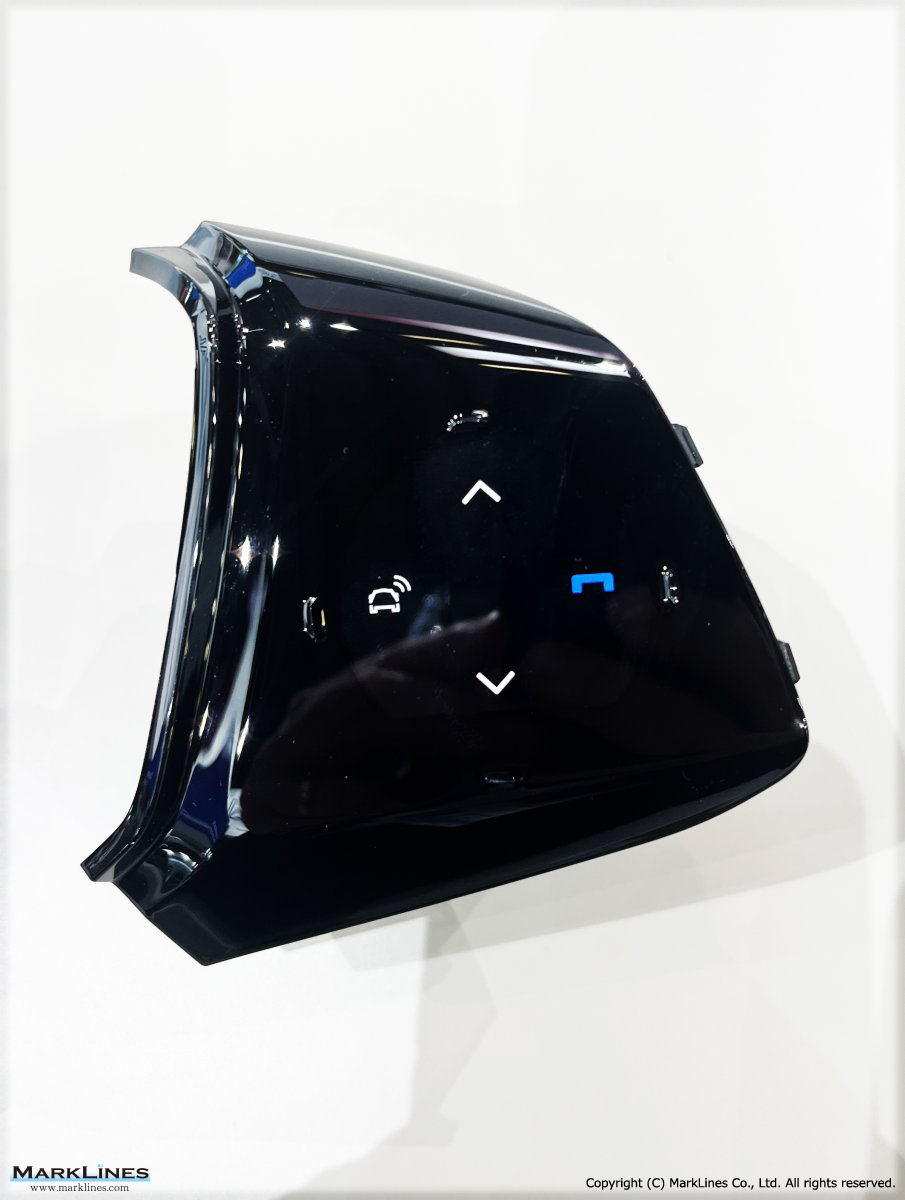
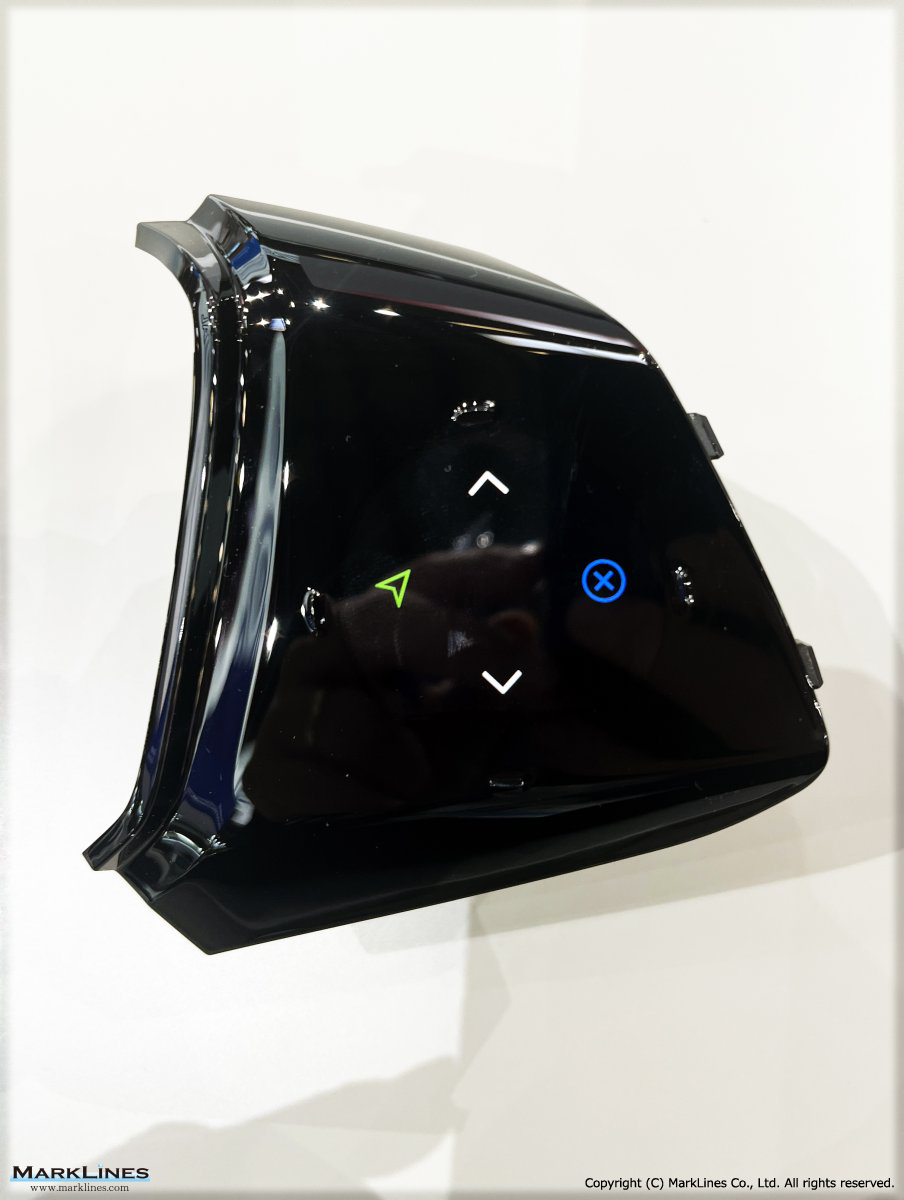
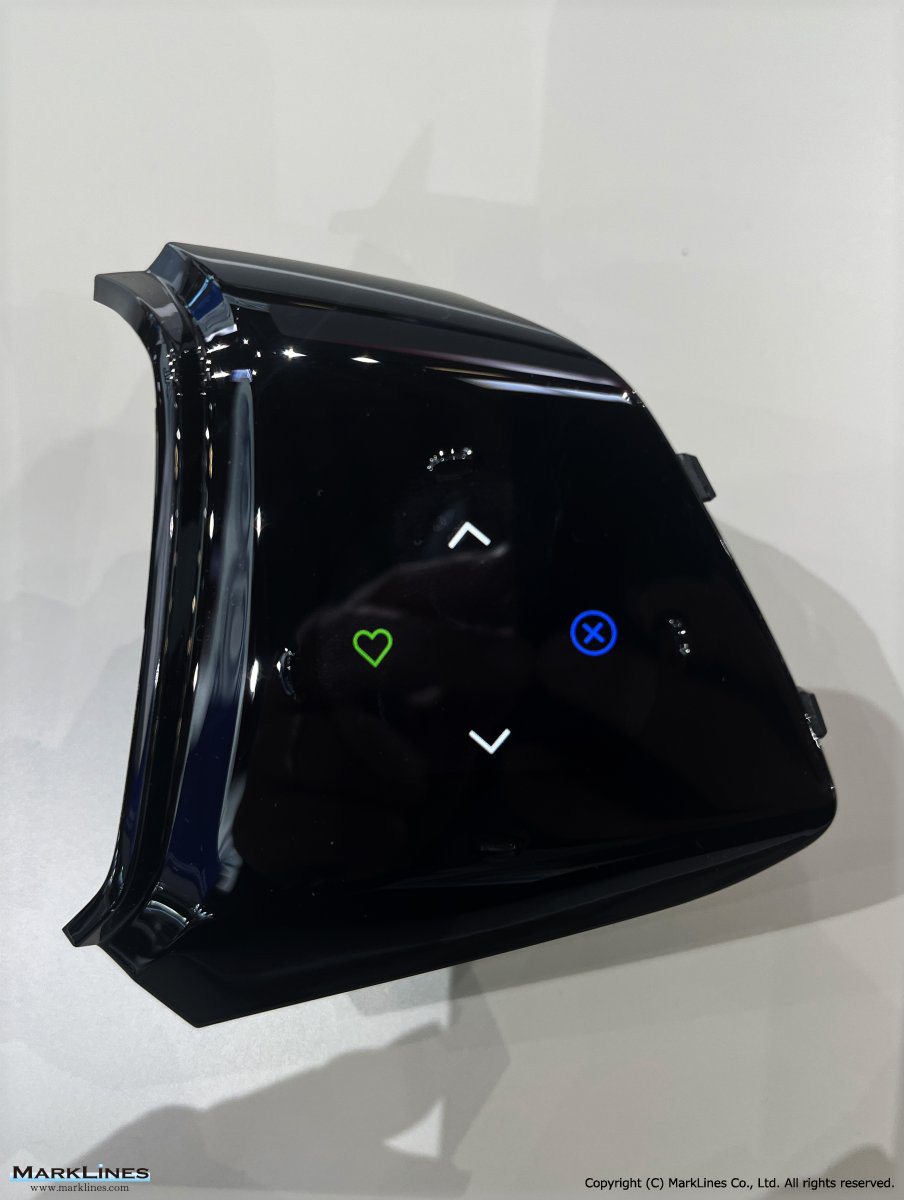
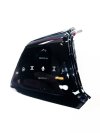
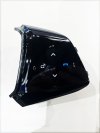
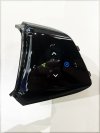
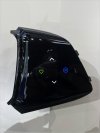
Steering wheel switches
Sort by :
1 - 20 of 63 results
Data changes for Sales Statistics
nd. November 13, 2013 South Africa Monthly sales data have been added for the eight automakers listed below since January 2011. Therefore, there are some data differences for total volumes since 2011. Added automakers 2011 2012 2013 Hyundai 48,897 52,391 43,172 Kia 18,403 26,267 19,323 Great Wall (GW) 6,198 7,755 5,988 Daihatsu 3,341 2,047 1,871 Chery 2,105 1,987 1,471 Foton 782 550 604 Proton 303 293 249 Haval 347 39 0 T...
Automotive Sales Data Updated at: 2026/05/22
China - New car sales in 2026 by OEM, model, vehicle type
kers Top10 - Maker Apr. 2026 (10,000) Y-o-Y 1 BYD Auto 18.2 -32.3% 2 Geely Automobile 15.2 -27.4% 3 Changan Automobile 9.5 -11.0% 4 FAW-VW 7.5 -32.1% 5 Chery Automobile 6.8 -30.5% 6 Leapmotor 5.7 63.5% 7 SAIC-GM-Wuling 5.4 -30.3% 8 GAC Toyota 5.4 -9.9% 9 SAIC VW 4.6 -44.8% 10 Great Wall 4.4 -19.6% Source: CPCAThree Japanese OEMs release April 2026 new car sales figures in China, all down y/yThree Japanese OEMs recently a...
Automotive Sales Data Updated at: 2026/05/15
New Zealand - New car sales in 2026 by OEM, vehicle type
h up for reasons including different information sources, and discrepancies between preliminary reports and confirmed data. Sales of new passenger cars Maker/Brand Apr. 2026 Share Jan.-Apr. 2026 Share Toyota 1,440 20.3% 5,506 16.5% Kia 595 8.4% 2,912 8.7% Mitsubishi 549 7.7% 2,972 8.9% Great Wall 445 6.3% 1,348 4.0% Suzuki 377 5.3% 1,566 4.7% MG 368 5.2% 1,726 5.2% BYD 309 4.3% 1,599 4.8% Mazda 247 3.5% 1,418 4.3% Hyundai 2...
Automotive Sales Data Updated at: 2026/05/12
South Africa - New car sales in 2026 by OEM, vehicle type
0.0% 249 243 2.5% Total 47,979 42,467 13.0% 209,925 186,599 12.5% Source: National Association of Automobile Manufacturers of South Africa (NAAMSA)Passenger+LCV Maker/Brand Apr. 2025 Share Toyota 9,842 21.7% Suzuki 5,363 11.8% VW 4,769 10.5% Hyundai 2,839 6.3% Ford 2,668 5.9% Great Wall Motors 2,485 5.5% Chery 2,462 5.4% JETOUR 1,804 4.0% Omoda / Jaecoo 1,383 3.0% BMW 1,366 3.0% Kia 1,242 2.7% Renault 1,216 2.7%...
Automotive Sales Data Updated at: 2026/05/07
New Zealand - New car sales in 2025 by OEM, vehicle type
er cars Maker/Brand Sep. 2025 Share Jan.-Sep. 2025 Share Toyota 2,564 24.8% 14,946 21.2% Mitsubishi 1,755 16.9% 7,840 11.1% Kia 945 9.1% 6,757 9.6% Mazda 523 5.0% 3,383 4.8% Ford 415 4.0% 3,087 4.4% Suzuki 414 4.0% 3,667 5.2% Hyundai 395 3.8% 2,656 3.8% MG 375 3.6% 3,118 4.4% Great Wall 295 2.8% 2,435 3.5% Honda 253 2.4% 2,590 3.7% Tesla 228 2.2% 1,242 1.8% Chery 225 2.2% 454 0.6% BMW 184 1.8% 1,408 2.0% Subaru 17...
Automotive Sales Data Updated at: 2026/02/13
Singapore - New car sales in 2025 by OEM
35 3.0% Nissan 118 2.6% Mazda 114 2.6% GAC 103 2.3% Kia 98 2.2% Subaru 87 2.0% Xpeng 70 1.6% Audi 61 1.4% M.G. 61 1.4% Porsche 50 1.1% VW 49 1.1% Chery Automobile 47 1.1% MINI 38 0.9% Volvo Cars 35 0.8% Skoda 34 0.8% Suzuki 23 0.5% Deepal 15 0.3% Dongfeng 15 0.3% Great Wall 15 0.3% Maxus 15 0.3% Polestar 12 0.3% ZEEKR 12 0.3% Others 52 1.2% Total 4,455 100.0% Source: Singapore Land Transport Author...
Automotive Sales Data Updated at: 2026/02/12
China - New car sales in 2025 by OEM, model, vehicle type
n methods. Passenger Car retail sales by Chinese Makers Top10 - Maker Oct. 2025 (10,000) Y-o-Y 1 BYD Auto 29.6 -31.4% 2 Geely Automobile 26.6 36.8% 3 FAW-VW 13.6 -3.9% 4 Changan Automobile 13.3 2.0% 5 Chery Automobile 13.3 -9.7% 6 SAIC-GM-Wuling 12.4 10.3% 7 SAIC VW 8.5 -29.5% 8 Great Wall 7.7 20.9% 9 GAC Toyota 7.2 -9.2% 10 FAW Toyota 7.1 -6.0% Source: CPCAThree Japanese OEMs release October 2025 new car sales figures ...
Automotive Sales Data Updated at: 2026/02/10
Australia - New car sales in 2025 by OEM, vehicle type
to 8,541 units, Mazda sales increased 4.2% to 7,562 units, Kia sales decreased 3.2% to 6,101 units and Hyundai sales increased 12.2% to 5,640 units. In 2025, the top three manufacturers, Toyota, Ford, and Mazda, saw decreases of 0.6%, 5.8%, and 4.2% respectively compared to the previous year, while Great Wall Motors (GWM) ranked 7th and BYD ranked 8th saw significant increases of 23.4% and 156.2%, respectively.FCAI Chief Executive Tony Weber said...
Automotive Sales Data Updated at: 2026/02/04
South Africa - New car sales in 2025 by OEM, vehicle type
9.4% 956 945 1.2% Total 48,983 41,101 19.2% 596,818 515,976 15.7% Source: National Association of Automobile Manufacturers of South Africa (NAAMSA)Passenger+LCV Maker/Brand Dec. 2025 Share Toyota 12,683 27.1% VW 4,986 10.6% Suzuki 4,961 10.6% Hyundai 3,051 6.5% Ford 2,940 6.3% Great Wall Motors 2,453 5.2% Chery 2,249 4.8% Isuzu 1,639 3.5% Kia 1,508 3.2% JETOUR 1,371 2.9% Omoda / Jaecoo 1,317 2.8% Renault 1,304 2....
Automotive Sales Data Updated at: 2026/02/03
Thailand - New car sales in 2024 by OEM, model, vehicle type
including Lexus) was down 12.9% to 17,786 units. Isuzu was down 42.2% to 6,784 units and Honda was down 27.9% to 5,442 units. BYD is in the 4th position up 95.2% to 2,686 units and Ford sales were down 29.2% to 1,949 units. Among other Chinese brands, MG was ranked 7th down 39.2% to 1,200 units and Great Wall Motor ranked 10th down 44.5% to 431 units.By body type, passenger cars were down 26.4% year over year to 16,571 units. Commercial vehicle s...
Automotive Sales Data Updated at: 2025/07/03
South Africa - New car sales in 2024 by OEM, vehicle type
Total 41,273 40,262 2.5% 515,712 531,775 -3.0% Source: National Association of Automobile Manufacturers of South Africa (NAAMSA) Passenger+LCV Maker/Brand Dec. 2024 Share Toyota 11,004 28.3% VW 4,785 12.3% Suzuki 4,514 11.6% Hyundai 2,809 7.2% Ford 2,520 6.5% Chery 1,867 4.8% Great Wall Motors 1,686 4.3% Kia 1,496 3.8% Isuzu 1,120 2.9% Renault 1,105 2.8% Mahindra 1,054 2.7% BMW 990 2.5% Nissan 807 2.1% Omoda &...
Automotive Sales Data Updated at: 2025/07/03
Singapore - New car sales in 2024 by OEM
0.8% 640 1.5% Audi 49 0.9% 596 1.4% Volvo Cars 53 1.0% 557 1.3% M.G. 28 0.5% 536 1.2% Subaru 48 0.9% 415 1.0% Skoda 53 1.0% 351 0.8% Xpeng 69 1.3% 336 0.8% GAC 17 0.3% 310 0.7% Suzuki 34 0.6% 255 0.6% MINI 30 0.6% 224 0.5% Peugeot 12 0.2% 185 0.4% Land Rover 19 0.3% 173 0.4% Great Wall 5 0.1% 147 0.3% Polestar 23 0.4% 140 0.3% Chery Automobile 27 0.5% 116 0.3% Others 94 1.7% 719 1.7% Total 5,442 100.0% 43,022 100.0...
Automotive Sales Data Updated at: 2025/07/03
New Zealand - New car sales in 2024 by OEM, vehicle type
ec. 2024 Share Jan.-Dec. 2024 Share Toyota 1,849 25.6% 20,669 23.7% Mitsubishi 996 13.8% 9,899 11.3% Kia 587 8.1% 8,663 9.9% Suzuki 297 4.1% 5,182 5.9% Ford 298 4.1% 4,650 5.3% Mazda 173 2.4% 3,726 4.3% Hyundai 183 2.5% 3,634 4.2% Honda 406 5.6% 3,169 3.6% MG 256 3.6% 3,060 3.5% Great Wall 237 3.3% 2,622 3.0% Nissan 103 1.4% 2,432 2.8% VW 132 1.8% 2,175 2.5% Subaru 286 4.0% 1,994 2.3% BMW 159 2.2% 1,483 1.7% Mercedes...
Automotive Sales Data Updated at: 2025/07/03
Mexico - New car sales in 2024 by OEM, vehicle type
sales increased 12.8% to 8,802 units, while Hyundai sales increased 8.4% to 4,243 units.JAC sold 2,102 vehicles, a 36.8% increase from last May.Chery and Omoda brands sales decreased 7.0% to 2,626 units, while Motornation sold 805 units of BAIC, Changan, and JMC vehicles, 19.3% more than last year.Great Wall Motor reported sales of 1,309 units during May 2024.Cumulative sales for the five months of the year were up 12.7% y/y to 585,722 units.On ...
Automotive Sales Data Updated at: 2025/07/03
China - New car sales in 2024 by OEM, model, vehicle type
retail sales by Chinese Makers Top10 - Maker Dec. 2024 (10,000) Y-o-Y 1 BYD Auto 40.3 34.3% 2 Chery Automobile 19.9 77.3% 3 Geely Automobile 18.6 46.9% 4 FAW-VW 16.1 -24.8% 5 Changan Automobile 15.7 25.0% 6 SAIC VW 15.1 2.8% 7 SAIC-GM-Wuling 12.8 22.2% 8 FAW Toyota 9.7 13.2% 9 Great Wall 8.6 22.3% 10 Tesla 8.3 9.4% Source: CPCA Three Japanese OEMs’ Chinese sales figures for 2024 all dropThree Japanese OEMs recently a...
Automotive Sales Data Updated at: 2025/07/02
New Zealand - Flash report, Automotive sales volume, 2023
1.3% 3,190 2.9% VW 136 1.6% 2,820 2.6% Subaru 86 1.0% 1,954 1.8% Haval 10 0.1% 1,887 1.7% BMW 120 1.4% 1,761 1.6% Skoda 111 1.3% 1,716 1.6% Mercedes-Benz 91 1.1% 1,486 1.3% Audi 44 0.5% 1,372 1.2% Lexus 101 1.2% 1,305 1.2% Land Rover 54 0.6% 1,222 1.1% MINI 93 1.1% 1,039 0.9% Great Wall 220 2.6% 898 0.8% Peugeot 55 0.6% 886 0.8% Volvo 20 0.2% 583 0.5% Polestar 72 0.8% 545 0.5% Jeep 70 0.8% 510 0.5% Porsche 1 0.0% ...
Automotive Sales Data Updated at: 2025/06/04
Russia - Flash report, Automotive sales volume, 2023
3% Tank 2,539 3.6% - -% -% 13,941 1.5% - -% -% Kia 808 1.1% 2,858 4.5% -71.7% 12,005 1.3% 66,095 9.6% -81.8% Changan N/A -% 713 1.1% -% 11,267 1.2% 5,627 0.8% 100.2% FAW 630 0.9% 117 0.2% 438.5% 10,203 1.1% 2,254 0.3% 352.7% Sollers 1,011 1.4% 14 0.0% 7121.4% 8,541 0.9% 14 0.0% 60907.1% Great Wall 914 1.3% 381 0.6% 139.9% 5,652 0.6% 1,641 0.2% 244.4% Jaecoo 4,389 6.2% - -% -% 4,389 0.5% - -% -% GAC 420 0.6% 18 0.0% 2233.3% 2,621 0...
Automotive Sales Data Updated at: 2025/06/04
China - Flash report, Automotive sales volume, 2023
nese Makers Top10 - Maker Nov. 2023 (10,000) Y-o-Y 1 BYD Auto 26.3 20.9% 2 Geely Automobile 17.0 34.4% 3 FAW-VW 16.7 43.3% 4 Changan Automobile 11.9 16.3% 5 SAIC VW 11.6 24.9% 6 Chery Automobile 9.4 74.0% 7 SAIC-GM-Wuling 8.3 23.5% 8 GAC Toyota 7.7 -1.9% 9 SAIC GM 7.6 4.1% 10 Great Wall 7.4 27.7% Source: CPCA Three Japanese OEMs’ Chinese sales figures for November 2023 all grow y/yThree Japanese OEMs recently announced...
Automotive Sales Data Updated at: 2025/06/04
Thailand - Flash report, Automotive sales volume, 2023
data compiled by Toyota Motor Thailand (TMT), by maker sales in November, Toyota was down 11.6% to 21,700 units. Isuzu was down 37.1% to 10,415 units and Honda was flat at 7,328 units. BYD is on the 4th position with 4,512 units and MG sales were up 29.5% to 2,500 units. Among other Chinese brands, Great Wall Motor (GWM) was ranked 8th with 1,573 units, up 74.6%, while Neta on the 9th with 1,492 units.By body type, passenger cars were up 21.2% ye...
Automotive Sales Data Updated at: 2025/06/04
Singapore - Flash report, Automotive sales volume, 2023
42 0.9% 186 0.6% Land Rover 19 0.4% 179 0.6% Subaru 2 0.0% 140 0.5% Polestar 9 0.2% 101 0.3% Ferrari 2 0.0% 97 0.3% Rolls-Royce 2 0.0% 95 0.3% KG Mobility / Ssangyong 20 0.4% 86 0.3% Maserati 14 0.3% 78 0.3% SEAT 11 0.2% 64 0.2% Mitsubishi 6 0.1% 62 0.2% Bentley 1 0.0% 58 0.2% Great Wall 15 0.3% 54 0.2% Jaguar 15 0.3% 49 0.2% Renault - -% 47 0.2% Aston Martin 4 0.1% 19 0.1% Jeep 3 0.1% 19 0.1% Lotus - -% 16 0.1% ...
Automotive Sales Data Updated at: 2025/06/04


 Japan
Japan USA
USA Mexico
 Germany
 China (Shanghai)
 Thailand
 India
India